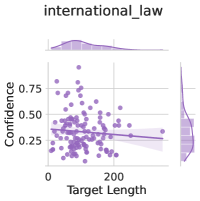
## Scatter Plot with Marginal Distributions: International Law Confidence vs. Target Length
### Overview
The image is a statistical visualization, specifically a scatter plot with marginal distribution plots (histograms/density plots) on the top and right sides. It explores the relationship between "Target Length" and "Confidence" within a context labeled "international_law". The overall aesthetic uses a monochromatic purple color scheme.
### Components/Axes
* **Title:** "international_law" (centered at the top).
* **Main Plot Axes:**
* **X-axis (Horizontal):** Labeled "Target Length". The axis has major tick marks at 0 and 200. The data points and axis extend slightly beyond 200, suggesting a range from approximately 0 to 250.
* **Y-axis (Vertical):** Labeled "Confidence". The axis has major tick marks at 0.25, 0.50, and 0.75. The visible range is from approximately 0.20 to 0.80.
* **Data Series:**
* **Scatter Points:** Numerous individual data points plotted as small, semi-transparent purple circles. Their density is highest in the lower-left quadrant of the plot.
* **Regression Line:** A solid, darker purple line showing the best-fit linear trend through the data.
* **Confidence Interval:** A semi-transparent, shaded purple band surrounding the regression line, indicating the uncertainty of the fit.
* **Marginal Plots:**
* **Top Marginal Plot:** A density plot (smoothed histogram) showing the distribution of the "Target Length" (X-axis) variable. It is positioned directly above the main plot, sharing the same X-axis scale.
* **Right Marginal Plot:** A density plot showing the distribution of the "Confidence" (Y-axis) variable. It is positioned to the right of the main plot, sharing the same Y-axis scale.
* **Legend:** There is no explicit legend box. The color coding is consistent: all elements (points, line, intervals, marginal plots) use shades of purple, implying they belong to the same dataset or analysis.
### Detailed Analysis
* **Data Distribution & Trend:**
* The scatter points show a wide dispersion. There is a high concentration of points where "Target Length" is between approximately 0 and 150, and "Confidence" is between 0.25 and 0.60.
* The regression line exhibits a clear **downward (negative) slope**. It starts at a Confidence value of approximately 0.45 when Target Length is 0 and declines to a Confidence value of approximately 0.30 when Target Length is 250.
* The shaded confidence interval around the regression line is relatively narrow, suggesting the negative trend is statistically discernible despite the scatter.
* **Marginal Distributions:**
* The **Target Length distribution (top)** is right-skewed. The peak density (mode) appears to be at a low Target Length value, approximately between 20 and 50. The tail extends towards higher values.
* The **Confidence distribution (right)** appears roughly unimodal and slightly left-skewed. The peak density is around a Confidence value of 0.40 to 0.45.
### Key Observations
1. **Negative Correlation:** The primary observation is a negative relationship between Target Length and Confidence. As the length of the target increases, the associated confidence tends to decrease.
2. **Data Density:** Most data points are clustered in the region of shorter target lengths and moderate confidence levels.
3. **Variability:** There is significant vertical scatter (variability in Confidence) for any given Target Length, especially at lower lengths. This indicates that while the trend is negative, Target Length alone does not perfectly predict Confidence.
4. **Outliers:** A few data points exist with relatively high Confidence (>0.70) at low-to-moderate Target Lengths. Conversely, several points show low Confidence (<0.25) across a range of lengths.
### Interpretation
The data suggests that within the domain of "international_law" (as defined by the source of this dataset), tasks or items characterized by longer "Targets" are associated with lower levels of "Confidence." This could imply several investigative hypotheses:
* **Complexity:** Longer targets (e.g., longer legal documents, more complex case descriptions) may be inherently more difficult to analyze or classify, leading to lower model or human confidence.
* **Ambiguity:** Increased length might introduce more ambiguity or nuanced information, making definitive judgments harder.
* **Data Sparsity:** The right-skewed distribution of Target Length means there are fewer examples of very long targets in the dataset. Models often perform with lower confidence on sparse or out-of-distribution data.
The marginal plots reinforce this: the most common cases (short targets) are also where confidence is most variable but centers around a moderate value. The overall pattern is not one of a strong, tight correlation but a general, statistically visible trend amidst considerable noise. This visualization would be crucial for understanding model performance or data characteristics in a legal AI system, highlighting that length is a factor impacting reliability.