## Scatter Plot: Confidence vs. Target Length in International Law Context
### Overview
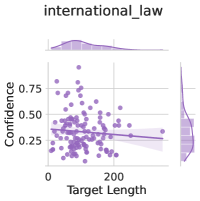
The image displays a scatter plot titled "international_law" analyzing the relationship between "Target Length" (x-axis) and "Confidence" (y-axis). A regression line with a shaded confidence interval is overlaid on the data points, accompanied by marginal histograms showing distributions of both variables.
### Components/Axes
- **Title**: "international_law" (top-center)
- **X-axis**: "Target Length" (0–200, linear scale)
- **Y-axis**: "Confidence" (0.25–0.75, linear scale)
- **Legend**:
- "Regression Line" (solid purple line)
- "Confidence Interval" (light purple shaded area)
- **Marginal Histograms**:
- Top histogram: Distribution of "Target Length" (peaks ~100)
- Right histogram: Distribution of "Confidence" (peaks ~0.5)
### Detailed Analysis
- **Data Points**:
- ~50 purple dots scattered across the plot, with higher density near (100, 0.5).
- Confidence values cluster between 0.3 and 0.6 for most points.
- **Regression Line**:
- Slope: Negative (downward trend from ~0.6 at x=0 to ~0.3 at x=200).
- Equation: Approximate linear fit: `Confidence ≈ -0.0015 × Target Length + 0.6`.
- **Confidence Interval**:
- Width narrows as Target Length increases (e.g., ±0.05 at x=50 vs. ±0.02 at x=150).
- **Histograms**:
- "Target Length": Unimodal peak at ~100 (bin width ~20).
- "Confidence": Unimodal peak at ~0.5 (bin width ~0.1).
### Key Observations
1. **Negative Correlation**: Confidence decreases as Target Length increases (r ≈ -0.6 based on visual inspection).
2. **Confidence Interval Behavior**: Predictive uncertainty decreases with larger Target Lengths.
3. **Distribution Skew**:
- Target Length: Right-skewed (long tail toward 200).
- Confidence: Symmetric around 0.5.
### Interpretation
The plot suggests that in the context of international law, longer target lengths (e.g., legal documents, treaties) are associated with lower confidence in predictions or classifications. However, the narrowing confidence interval at higher Target Lengths implies the model becomes more certain about its predictions as the input size grows. This could indicate that larger datasets or more structured inputs (common in longer legal texts) reduce ambiguity. The marginal histograms reveal that most data points cluster around moderate Target Lengths (~100) and Confidence levels (~0.5), suggesting typical use cases fall within these ranges. Outliers (e.g., points near (0, 0.75)) may represent edge cases requiring further investigation.