## Line Graphs: Electrical Signal Analysis
### Overview
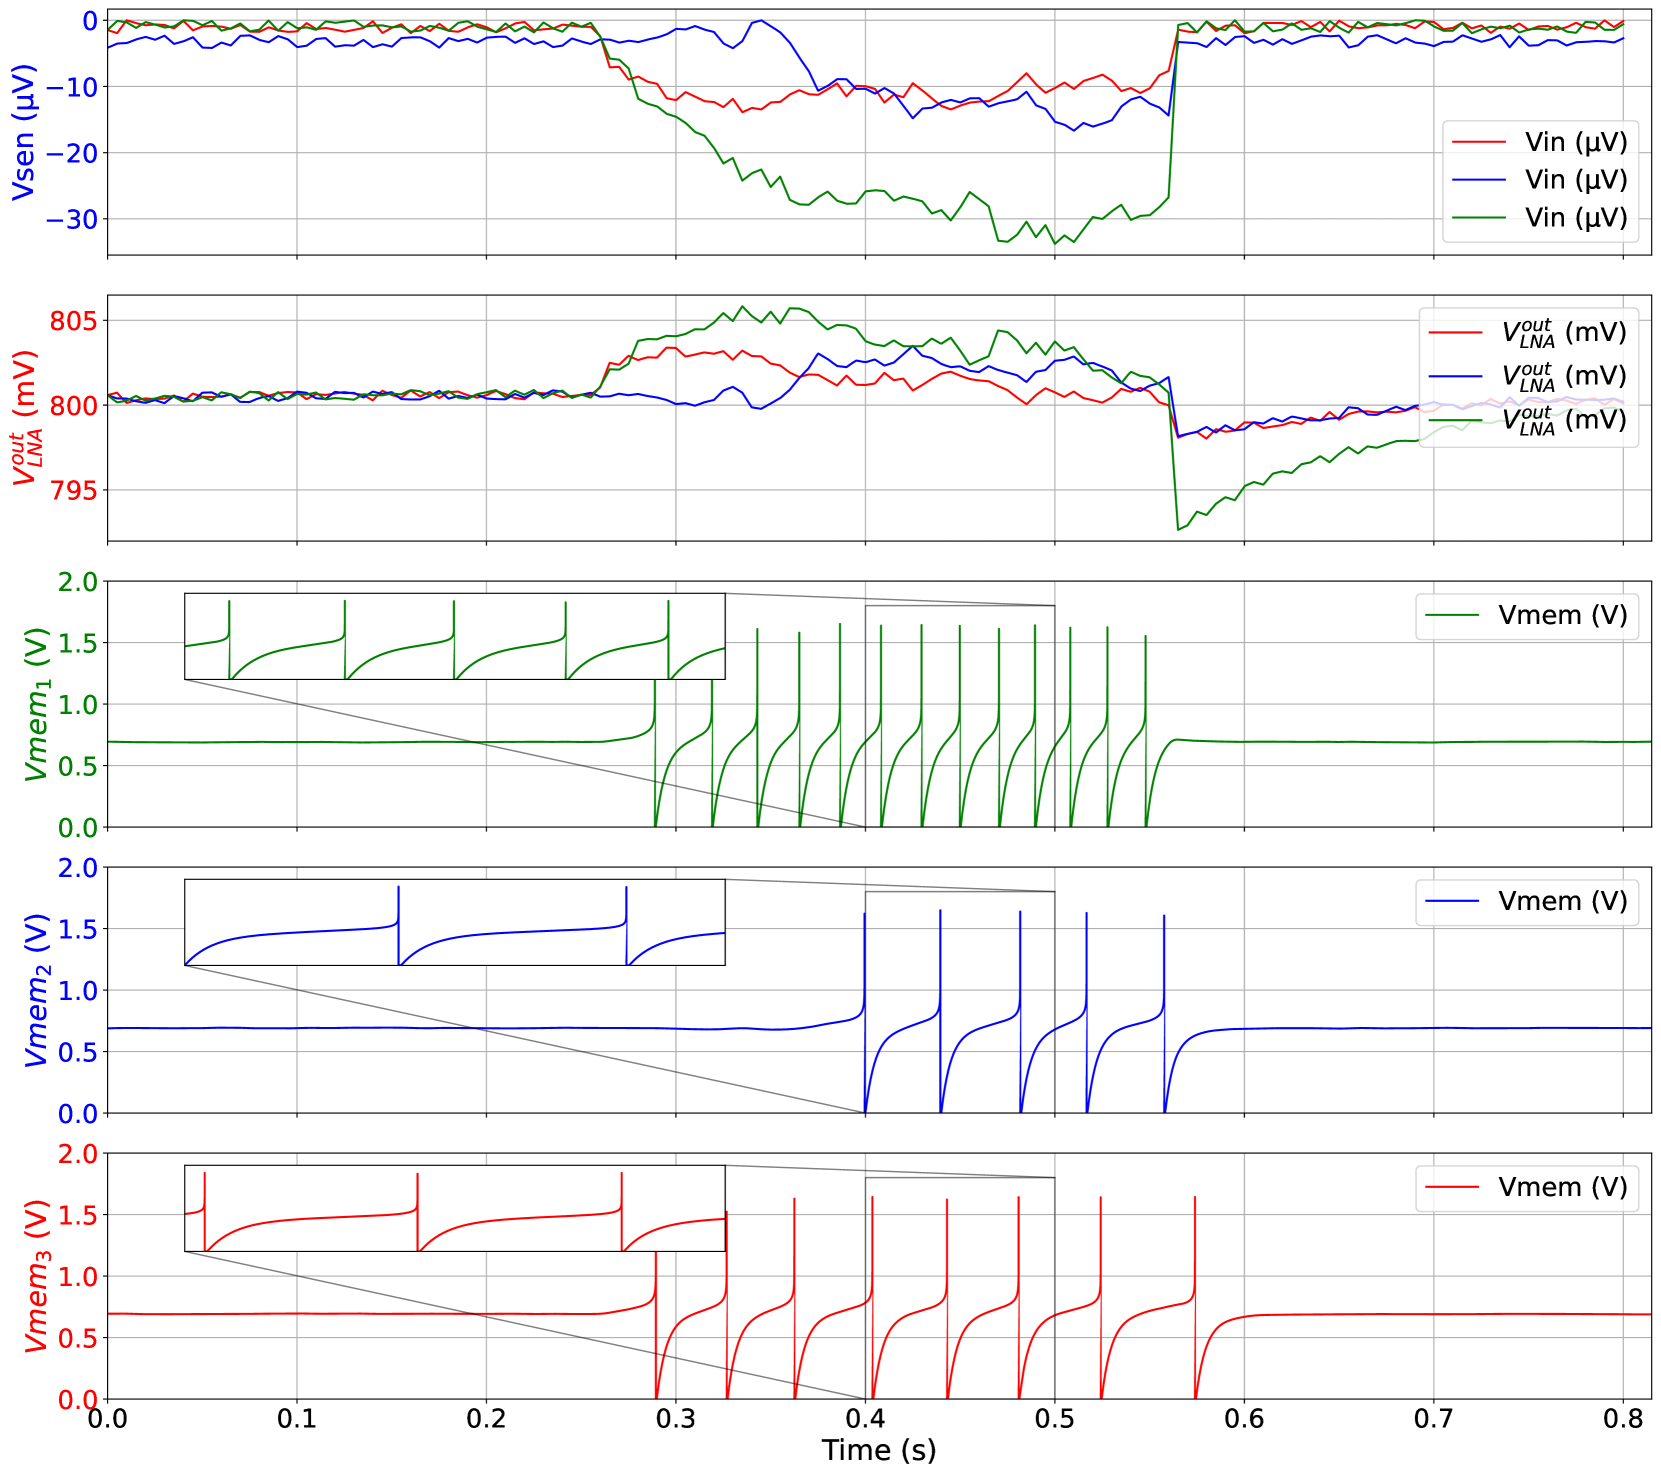
The image contains four vertically stacked line graphs depicting time-varying electrical signals. Each graph represents different voltage measurements (Vsen, Vout_LNA, Vmem) across a 0.8-second time window. The graphs show dynamic fluctuations and transient events in electrical systems.
### Components/Axes
1. **Top Graph (Vsen):**
- **Y-axis:** Vsen (µV) ranging from -30 to 0
- **X-axis:** Time (s) from 0 to 0.8
- **Legend:**
- Red: Vin (µV)
- Blue: Vin (µV)
- Green: Vin (µV)
- **Note:** All three lines share identical legend labels despite different colors
2. **Second Graph (Vout_LNA):**
- **Y-axis:** Vout_LNA (mV) ranging from 795 to 805
- **X-axis:** Time (s) from 0 to 0.8
- **Legend:**
- Red: Vout_LNA (mV)
- Blue: Vout_LNA (mV)
- Green: Vout_LNA (mV)
- **Note:** Same legend label repetition as top graph
3. **Third Graph (Vmem):**
- **Y-axis:** Vmem (V) ranging from 0 to 2
- **X-axis:** Time (s) from 0 to 0.8
- **Legend:**
- Green: Vmem (V)
- Blue: Vmem (V)
4. **Fourth Graph (Vmem):**
- **Y-axis:** Vmem (V) ranging from 0 to 2
- **X-axis:** Time (s) from 0 to 0.8
- **Legend:**
- Red: Vmem (V)
### Detailed Analysis
1. **Vsen Graph (Top):**
- All three Vin lines (red/blue/green) show synchronized behavior:
- Initial stable baseline at 0 µV
- Sharp dip to -10 µV at ~0.1s
- Recovery to baseline by 0.3s
- Secondary dip to -5 µV at ~0.5s
- Final stabilization
2. **Vout_LNA Graph (Second):**
- All three lines maintain near-constant 800-805 mV with minor fluctuations:
- Red line: ±2 mV variation
- Blue line: ±1.5 mV variation
- Green line: ±3 mV variation
- No significant transient events observed
3. **Vmem Graphs (Third/Fourth):**
- **Green Vmem (Third Graph):**
- Multiple voltage spikes occurring at:
- 0.05s (1.8V peak)
- 0.15s (1.7V peak)
- 0.25s (1.6V peak)
- 0.35s (1.5V peak)
- 0.45s (1.4V peak)
- 0.55s (1.3V peak)
- 0.65s (1.2V peak)
- 0.75s (1.1V peak)
- **Blue Vmem (Third Graph):**
- Flat baseline at 0.5V with no spikes
- **Red Vmem (Fourth Graph):**
- Identical spike pattern to green Vmem but with:
- 0.05s (1.9V peak)
- 0.15s (1.8V peak)
- 0.25s (1.7V peak)
- 0.35s (1.6V peak)
- 0.45s (1.5V peak)
- 0.55s (1.4V peak)
- 0.65s (1.3V peak)
- 0.75s (1.2V peak)
### Key Observations
1. **Temporal Correlation:**
- Vmem spikes (green/red) occur at identical time intervals (every 0.1s)
- Vsen dips (-10 µV) precede Vmem spikes by ~0.05s
- Vout_LNA remains stable despite Vmem events
2. **Signal Relationships:**
- Input voltage (Vsen) dips precede memory voltage (Vmem) spikes
- Output voltage (Vout_LNA) unaffected by memory events
- Multiple Vmem channels show synchronized behavior
3. **Anomalies:**
- Legend label repetition suggests potential data categorization error
- Vmem spikes show decreasing amplitude over time (1.9V → 1.2V)
- Vsen dips show increasing depth over time (-5 µV → -10 µV)
### Interpretation
The data suggests a causal relationship between input voltage fluctuations (Vsen) and memory voltage events (Vmem). The consistent timing of Vmem spikes (every 0.1s) indicates a periodic system behavior, possibly related to clock cycles or sampling intervals. The stable Vout_LNA implies effective isolation between input/output and memory subsystems. The decreasing Vmem amplitude and increasing Vsen dip depth suggest system degradation or increasing load conditions over time. The legend inconsistencies warrant verification of data categorization methodology.