## Line Chart: Accuracy vs. Percentage
### Overview
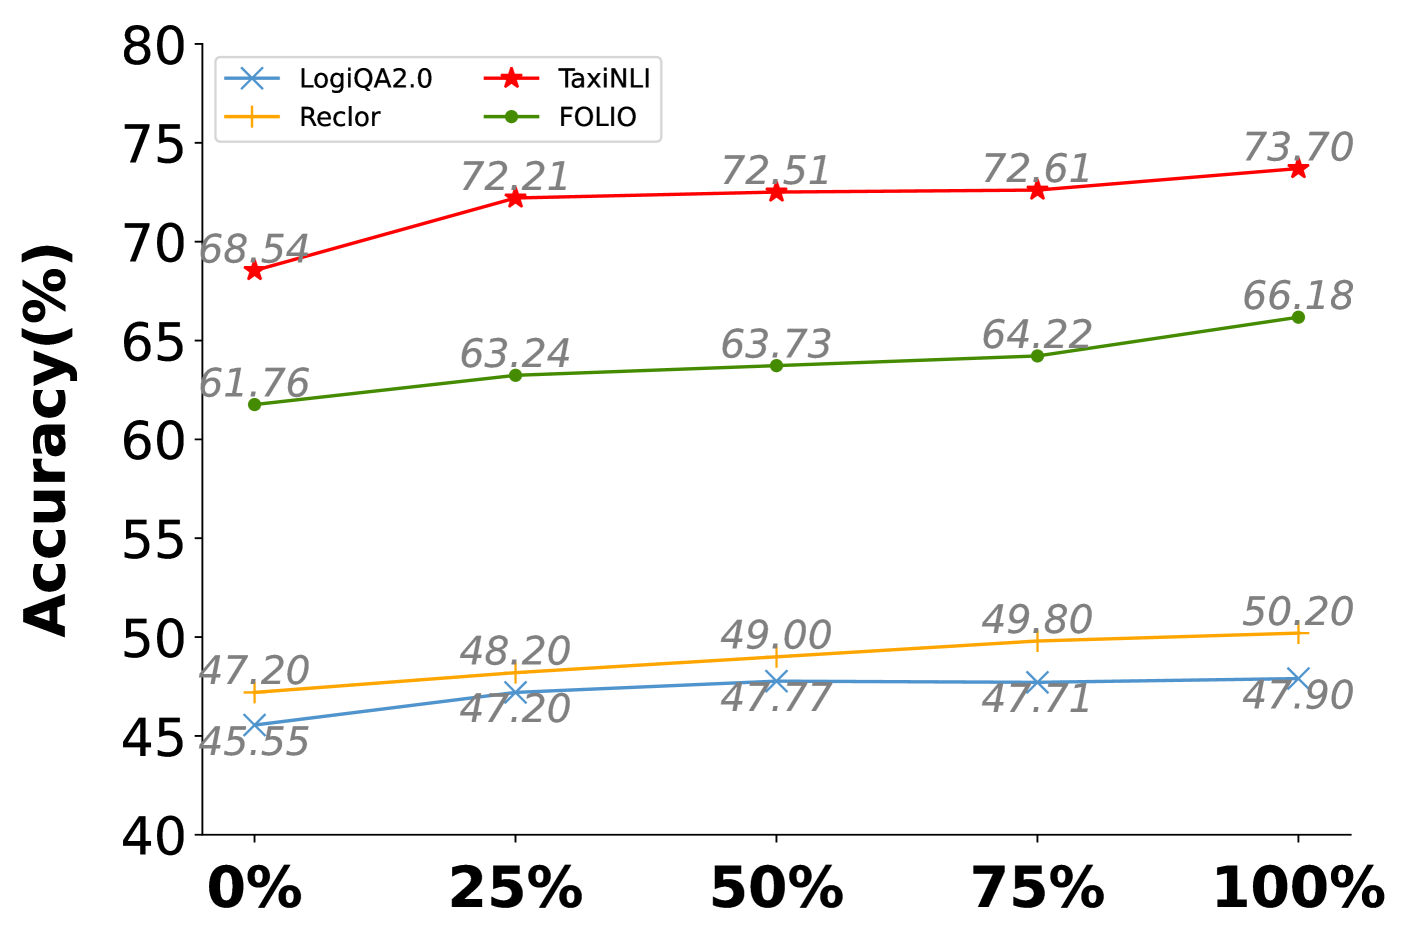
This image presents a line chart comparing the accuracy of four different models – LogiQA2.0, TaxiNLI, Reclor, and FOLIO – across varying percentages, ranging from 0% to 100%. The y-axis represents accuracy in percentage points, while the x-axis represents the percentage.
### Components/Axes
* **X-axis Title:** Percentage (%)
* **X-axis Markers:** 0%, 25%, 50%, 75%, 100%
* **Y-axis Title:** Accuracy (%)
* **Y-axis Scale:** 40 to 80, with increments of 5.
* **Legend:** Located at the top-right corner of the chart.
* LogiQA2.0 (Blue Line with 'x' markers)
* TaxiNLI (Red Line with Triangle markers)
* Reclor (Yellow Line with '+' markers)
* FOLIO (Green Line with Diamond markers)
### Detailed Analysis
Here's a breakdown of each model's accuracy at the specified percentages:
* **LogiQA2.0 (Blue):**
* 0%: 61.76%
* 25%: 63.24%
* 50%: 63.73%
* 75%: 64.22%
* 100%: 66.18%
* *Trend:* The blue line exhibits a generally upward slope, indicating increasing accuracy with increasing percentage.
* **TaxiNLI (Red):**
* 0%: 68.54%
* 25%: 72.21%
* 50%: 72.51%
* 75%: 72.61%
* 100%: 73.10%
* *Trend:* The red line shows a slight upward trend, with accuracy increasing initially and then plateauing.
* **Reclor (Yellow):**
* 0%: 45.55%
* 25%: 47.20%
* 50%: 47.77%
* 75%: 47.71%
* 100%: 49.80%
* *Trend:* The yellow line demonstrates a very gradual upward slope, indicating a slow increase in accuracy.
* **FOLIO (Green):**
* 0%: 47.20%
* 25%: 48.20%
* 50%: 49.00%
* 75%: 49.80%
* 100%: 50.20%
* *Trend:* The green line shows a slight upward trend, with a relatively consistent increase in accuracy.
### Key Observations
* TaxiNLI consistently exhibits the highest accuracy across all percentages.
* Reclor and FOLIO start with the lowest accuracy and show the slowest improvement.
* LogiQA2.0 shows a moderate and consistent increase in accuracy.
* The accuracy differences between TaxiNLI, LogiQA2.0, Reclor, and FOLIO become more pronounced at higher percentages.
### Interpretation
The chart demonstrates a comparative performance evaluation of four models (LogiQA2.0, TaxiNLI, Reclor, and FOLIO) as the percentage input changes. TaxiNLI consistently outperforms the other models, suggesting it is the most robust or well-suited for this task across the tested range. Reclor and FOLIO exhibit significantly lower accuracy, indicating they may require further optimization or are less effective for this specific application. The upward trends observed for all models suggest that increasing the percentage generally leads to improved accuracy, although the rate of improvement varies considerably. The plateauing of TaxiNLI's accuracy at higher percentages could indicate a saturation point where further increases in percentage yield diminishing returns. This data could be used to inform model selection and resource allocation, prioritizing TaxiNLI for tasks where high accuracy is critical and potentially focusing development efforts on improving the performance of Reclor and FOLIO.