## Line Chart: Model Accuracy Across Data Percentages
### Overview
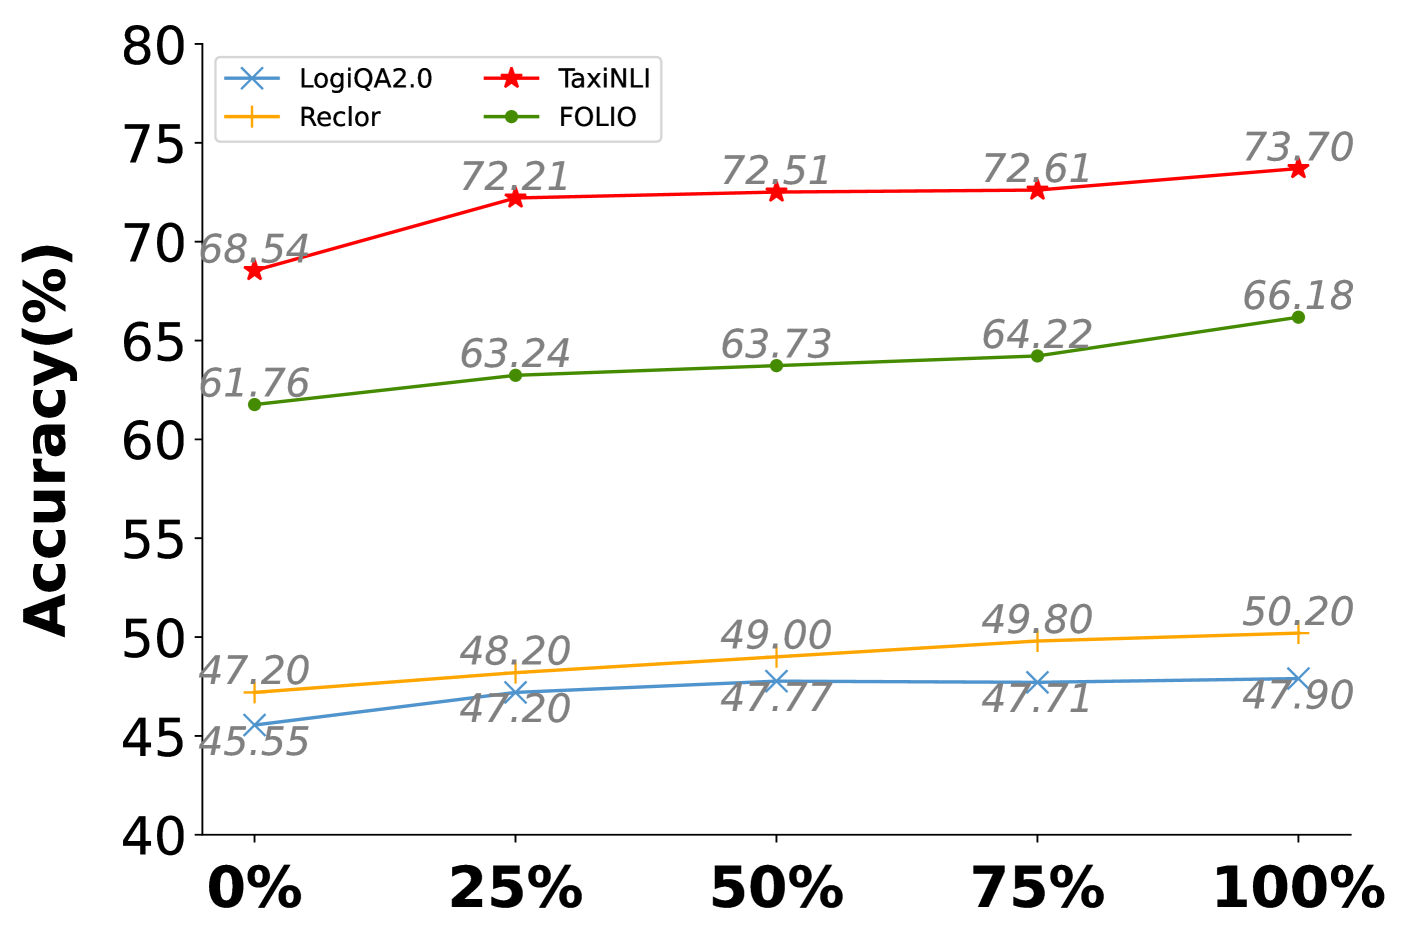
The chart compares the accuracy (%) of four models (LogiQA2.0, Reclor, TaxiNLI, FOLIO) across five data percentage thresholds (0%, 25%, 50%, 75%, 100%). Accuracy is plotted on the y-axis (40–80%), and data percentages are on the x-axis. The legend is positioned in the top-right corner, with distinct colors and markers for each model.
### Components/Axes
- **Y-axis**: Accuracy (%) ranging from 40% to 80% in 5% increments.
- **X-axis**: Data percentages (0%, 25%, 50%, 75%, 100%).
- **Legend**:
- **LogiQA2.0**: Blue line with "×" markers.
- **Reclor**: Orange line with "+" markers.
- **TaxiNLI**: Red line with "★" markers.
- **FOLIO**: Green line with "●" markers.
### Detailed Analysis
1. **LogiQA2.0 (Blue ×)**:
- 0%: 45.55%
- 25%: 47.20%
- 50%: 47.77%
- 75%: 47.71%
- 100%: 47.90%
- **Trend**: Slight upward slope with minimal fluctuation.
2. **Reclor (Orange +)**:
- 0%: 47.20%
- 25%: 48.20%
- 50%: 49.00%
- 75%: 49.80%
- 100%: 50.20%
- **Trend**: Steady linear increase.
3. **TaxiNLI (Red ★)**:
- 0%: 68.54%
- 25%: 72.21%
- 50%: 72.51%
- 75%: 72.61%
- 100%: 73.70%
- **Trend**: Sharp initial rise, then plateau with a final uptick.
4. **FOLIO (Green ●)**:
- 0%: 61.76%
- 25%: 63.24%
- 50%: 63.73%
- 75%: 64.22%
- 100%: 66.18%
- **Trend**: Gradual upward curve.
### Key Observations
- **TaxiNLI** consistently outperforms all models, achieving the highest accuracy (73.70% at 100%).
- **LogiQA2.0** has the lowest accuracy across all thresholds, with values clustered between 45.55% and 47.90%.
- **Reclor** and **FOLIO** show moderate performance, with Reclor slightly outperforming FOLIO at lower thresholds (e.g., 49.00% vs. 63.73% at 50%).
- All models improve as data percentage increases, but TaxiNLI’s gains are disproportionately larger.
### Interpretation
The data suggests **TaxiNLI** is the most robust model, maintaining high accuracy even with minimal data (68.54% at 0%). Its performance stabilizes near 72–73% as data increases, indicating strong generalization. **LogiQA2.0**’s low scores may reflect architectural limitations or training data inefficiencies. The gradual improvements across models highlight the importance of data volume, with TaxiNLI benefiting most from larger datasets. Reclor’s linear growth and FOLIO’s steady climb suggest incremental gains with more data, but neither matches TaxiNLI’s efficiency. This chart underscores the need for model-specific optimizations to bridge performance gaps.