## Diagram Type: Flowchart
### Overview
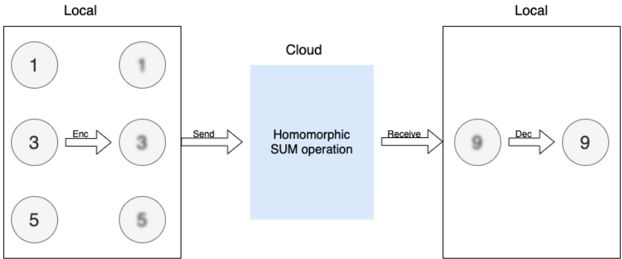
The image is a flowchart that illustrates the process of data transmission and processing between a local system and a cloud-based system. The flowchart is divided into three main sections: Local, Cloud, and Local again.
### Components/Axes
- **Local**: This section contains two rectangles, each with a circle inside. The circles are labeled with numbers 1, 3, 5, and 9. The rectangles are labeled "Local" at the top.
- **Cloud**: This section contains a rectangle labeled "Cloud" with a blue background. Inside the rectangle, there is text that reads "Homomorphic SUM operation."
- **Local**: This section contains two rectangles, each with a circle inside. The circles are labeled with numbers 1, 3, 5, and 9. The rectangles are labeled "Local" at the top.
### Detailed Analysis or ### Content Details
- The flowchart shows a process where data is transmitted from a local system to a cloud-based system and then processed by the cloud system.
- The "Homomorphic SUM operation" is performed by the cloud system on the data received from the local system.
- The data is then transmitted back to the local system for further processing or storage.
### Key Observations
- The flowchart demonstrates the concept of homomorphic encryption, which allows for data to be processed in the cloud without being decrypted.
- The use of homomorphic encryption ensures that the data remains secure and private during transmission and processing.
### Interpretation
The data suggests that the flowchart is illustrating the process of data transmission and processing between a local system and a cloud-based system using homomorphic encryption. The use of homomorphic encryption ensures that the data remains secure and private during transmission and processing. The flowchart demonstrates the concept of data processing in the cloud without being decrypted, which is a key advantage of cloud computing.