## Line Graph: Test Loss vs. Parameters (excluding embedding)
### Overview
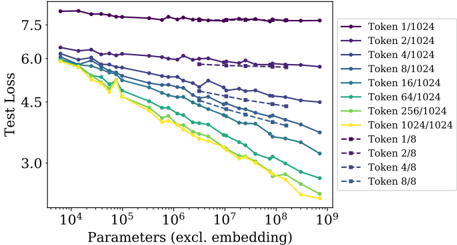
The image is a line graph comparing test loss across different parameter configurations (excluding embedding) for various token ratios. The x-axis represents parameters (log scale from 10⁴ to 10⁹), and the y-axis represents test loss (linear scale from 3.0 to 7.5). Multiple lines represent different token configurations, with colors corresponding to legend labels.
### Components/Axes
- **X-axis**: "Parameters (excl. embedding)" (log scale: 10⁴, 10⁵, 10⁶, 10⁷, 10⁸, 10⁹)
- **Y-axis**: "Test Loss" (linear scale: 3.0, 4.5, 6.0, 7.5)
- **Legend**: Located on the right, with 12 entries:
- **Token 1/1024** (purple)
- **Token 2/1024** (dark purple)
- **Token 4/1024** (blue)
- **Token 8/1024** (teal)
- **Token 16/1024** (light teal)
- **Token 64/1024** (green)
- **Token 256/1024** (lime)
- **Token 1024/1024** (yellow)
- **Token 1/8** (dark purple)
- **Token 2/8** (purple)
- **Token 4/8** (blue)
- **Token 8/8** (teal)
### Detailed Analysis
1. **Token 1/1024** (purple): Starts at ~7.5, remains flat with minimal fluctuation.
2. **Token 2/1024** (dark purple): Starts at ~6.0, decreases slightly to ~5.8.
3. **Token 4/1024** (blue): Starts at ~6.0, decreases to ~5.5.
4. **Token 8/1024** (teal): Starts at ~6.0, decreases to ~5.0.
5. **Token 16/1024** (light teal): Starts at ~6.0, decreases to ~4.5.
6. **Token 64/1024** (green): Starts at ~6.0, decreases to ~4.0.
7. **Token 256/1024** (lime): Starts at ~6.0, decreases to ~3.5.
8. **Token 1024/1024** (yellow): Starts at ~6.0, decreases to ~2.5.
9. **Token 1/8** (dark purple): Starts at ~6.0, remains flat.
10. **Token 2/8** (purple): Starts at ~6.0, decreases slightly to ~5.8.
11. **Token 4/8** (blue): Starts at ~6.0, decreases to ~5.5.
12. **Token 8/8** (teal): Starts at ~6.0, decreases to ~4.5.
### Key Observations
- **Downward Trend**: All lines show a general decrease in test loss as parameters increase, except for Token 1/1024 and Token 1/8, which remain flat.
- **Token Ratio Impact**: Higher token ratios (e.g., 1024/1024) achieve lower test loss compared to lower ratios (e.g., 1/1024).
- **Diminishing Returns**: Lines for Token 1/8 and Token 8/8 flatten at higher parameter ranges, suggesting limited sensitivity to parameter growth.
- **Overlap**: Lines for Token 1/1024 and Token 1/8 overlap at the top of the graph (~7.5 test loss).
### Interpretation
The data demonstrates that increasing parameters reduces test loss, particularly for higher token configurations (e.g., 1024/1024). This suggests that larger models with balanced token ratios (e.g., 1024/1024) achieve better performance. However, the flat lines for Token 1/1024 and Token 1/8 indicate that extremely low token ratios may not benefit from parameter scaling. The diminishing returns for Token 8/8 imply that beyond a certain parameter threshold, further increases yield minimal improvements. This aligns with common machine learning principles where model capacity and data complexity interact to determine performance gains.