## Chart: Test Loss vs. Parameters for Different Token Ratios
### Overview
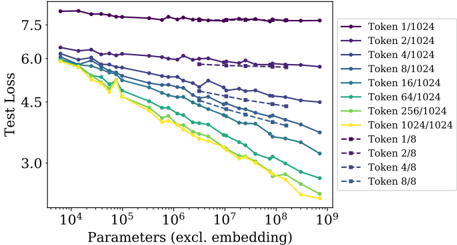
The image is a line chart showing the relationship between the number of parameters (excluding embedding) and the test loss for different token ratios. The x-axis represents the number of parameters on a logarithmic scale, ranging from 10^4 to 10^9. The y-axis represents the test loss, ranging from approximately 3.0 to 7.5. Different colored lines represent different token ratios, as indicated in the legend on the right side of the chart.
### Components/Axes
* **X-axis:** Parameters (excl. embedding), logarithmic scale from 10^4 to 10^9.
* **Y-axis:** Test Loss, linear scale from 3.0 to 7.5.
* **Legend (Top-Right):**
* Purple: Token 1/1024
* Dark Blue: Token 2/1024
* Blue: Token 4/1024
* Dark Teal: Token 8/1024
* Teal: Token 16/1024
* Green: Token 64/1024
* Light Green: Token 256/1024
* Yellow: Token 1024/1024
* Dashed Purple: Token 1/8
* Dashed Dark Blue: Token 2/8
* Dashed Blue: Token 4/8
* Dashed Dark Teal: Token 8/8
### Detailed Analysis
* **Token 1/1024 (Purple):** The line is relatively flat, showing a slight decrease in test loss as the number of parameters increases. The test loss starts around 7.8 at 10^4 parameters and decreases to approximately 7.5 at 10^9 parameters.
* **Token 2/1024 (Dark Blue):** The line shows a gradual decrease in test loss as the number of parameters increases. The test loss starts around 6.3 at 10^4 parameters and decreases to approximately 5.8 at 10^9 parameters.
* **Token 4/1024 (Blue):** The line shows a decrease in test loss as the number of parameters increases. The test loss starts around 6.0 at 10^4 parameters and decreases to approximately 5.2 at 10^9 parameters.
* **Token 8/1024 (Dark Teal):** The line shows a decrease in test loss as the number of parameters increases. The test loss starts around 5.9 at 10^4 parameters and decreases to approximately 4.8 at 10^9 parameters.
* **Token 16/1024 (Teal):** The line shows a decrease in test loss as the number of parameters increases. The test loss starts around 5.7 at 10^4 parameters and decreases to approximately 4.2 at 10^9 parameters.
* **Token 64/1024 (Green):** The line shows a decrease in test loss as the number of parameters increases. The test loss starts around 5.5 at 10^4 parameters and decreases to approximately 3.7 at 10^9 parameters.
* **Token 256/1024 (Light Green):** The line shows a decrease in test loss as the number of parameters increases. The test loss starts around 5.3 at 10^4 parameters and decreases to approximately 3.3 at 10^9 parameters.
* **Token 1024/1024 (Yellow):** The line shows a decrease in test loss as the number of parameters increases. The test loss starts around 5.1 at 10^4 parameters and decreases to approximately 3.0 at 10^9 parameters.
* **Token 1/8 (Dashed Purple):** The line shows a slight decrease in test loss as the number of parameters increases. The test loss starts around 6.1 at 10^4 parameters and decreases to approximately 5.9 at 10^7 parameters.
* **Token 2/8 (Dashed Dark Blue):** The line shows a decrease in test loss as the number of parameters increases. The test loss starts around 5.8 at 10^4 parameters and decreases to approximately 5.2 at 10^7 parameters.
* **Token 4/8 (Dashed Blue):** The line shows a decrease in test loss as the number of parameters increases. The test loss starts around 5.5 at 10^4 parameters and decreases to approximately 4.8 at 10^7 parameters.
* **Token 8/8 (Dashed Dark Teal):** The line shows a decrease in test loss as the number of parameters increases. The test loss starts around 5.3 at 10^4 parameters and decreases to approximately 4.5 at 10^7 parameters.
### Key Observations
* As the token ratio increases (e.g., from 1/1024 to 1024/1024), the test loss generally decreases for a given number of parameters.
* The test loss decreases more significantly for higher token ratios as the number of parameters increases.
* The "Token 1/1024" series shows the least improvement in test loss with increasing parameters.
* The dashed lines (Token 1/8, 2/8, 4/8, 8/8) only extend to 10^7 parameters.
### Interpretation
The chart suggests that increasing the token ratio and the number of parameters (excluding embedding) generally leads to a lower test loss, indicating better model performance. The token ratio seems to have a significant impact on the model's ability to learn, with higher ratios resulting in lower test loss. The "Token 1/1024" series, which has the lowest token ratio, shows the least improvement, suggesting that a sufficient token ratio is crucial for effective learning. The dashed lines stopping at 10^7 parameters might indicate a limitation or constraint in the experiment setup for those specific token ratios.