## Line Chart: KV-Cache Memory Usage vs. Latent Dimension Ratio
### Overview
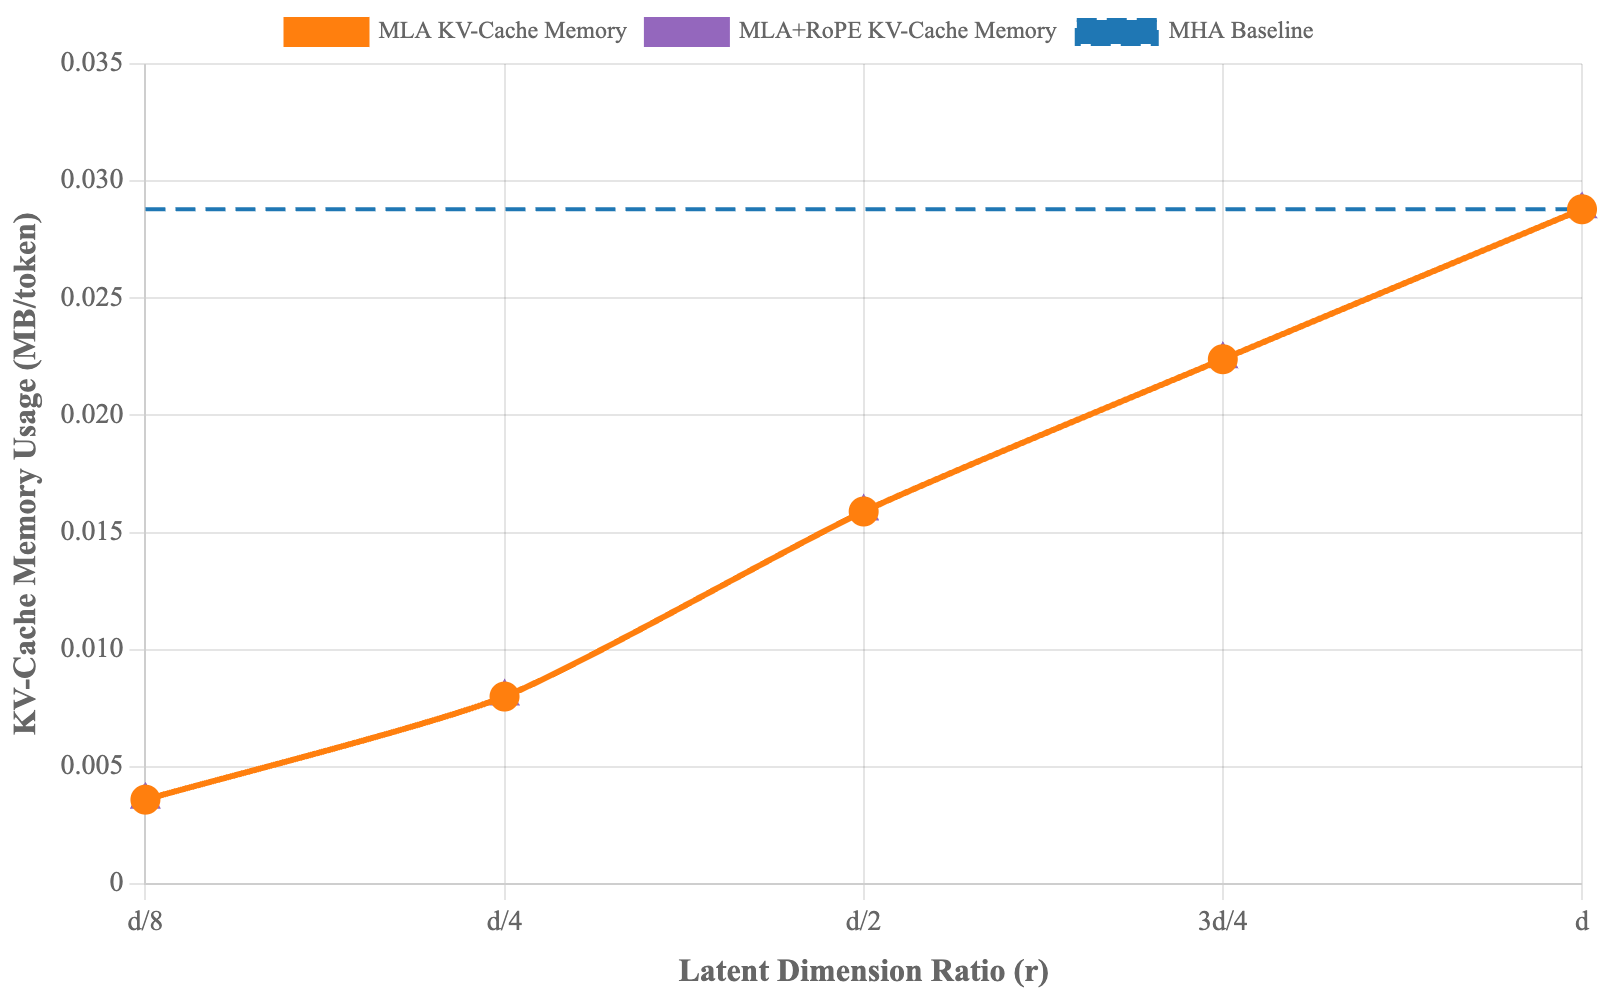
This image displays a line chart comparing the KV-Cache memory usage (measured in MB/token) of an "MLA" (Multi-Head Latent Attention) architecture against an "MHA" (Multi-Head Attention) baseline. The x-axis represents the "Latent Dimension Ratio (r)," showing how memory usage scales as the latent dimension increases from d/8 to d.
### Components/Axes
* **Y-Axis:** "KV-Cache Memory Usage (MB/token)". The scale ranges from 0.000 to 0.035, with major grid lines at intervals of 0.005.
* **X-Axis:** "Latent Dimension Ratio (r)". The axis is categorical/ordinal, with five distinct points: d/8, d/4, d/2, 3d/4, and d.
* **Legend (Top Center):**
* **Orange Rectangle:** "MLA KV-Cache Memory" (Corresponds to the solid orange line with circular markers).
* **Purple Rectangle:** "MLA+RoPE KV-Cache Memory" (Note: There is no corresponding purple line or data series plotted on the chart).
* **Blue Dashed Line:** "MHA Baseline" (Corresponds to the horizontal blue dashed line).
### Detailed Analysis
**Trend Verification:**
* **MLA KV-Cache Memory (Orange Line):** The line exhibits a consistent, positive, near-linear upward slope. As the latent dimension ratio increases from d/8 to d, the memory usage increases steadily.
* **MHA Baseline (Blue Dashed Line):** The line is perfectly horizontal, indicating that the MHA baseline memory usage remains constant regardless of the latent dimension ratio.
**Data Extraction (Approximate Values):**
* **At d/8:** MLA usage is approximately 0.0035 MB/token.
* **At d/4:** MLA usage is approximately 0.008 MB/token.
* **At d/2:** MLA usage is approximately 0.016 MB/token.
* **At 3d/4:** MLA usage is approximately 0.0225 MB/token.
* **At d:** MLA usage is approximately 0.029 MB/token.
* **MHA Baseline:** Constant at approximately 0.029 MB/token across all x-axis points.
### Key Observations
* **Convergence:** The MLA memory usage curve converges with the MHA baseline exactly at the point where the latent dimension ratio is "d".
* **Efficiency Gain:** At lower latent dimension ratios (e.g., d/8), the MLA architecture provides a significant reduction in memory usage compared to the MHA baseline (roughly an 8x reduction).
* **Missing Data:** The legend includes an entry for "MLA+RoPE KV-Cache Memory" (purple), but no data series is plotted for this category. This is a notable omission in the provided visualization.
### Interpretation
This chart illustrates the memory efficiency trade-offs inherent in the Multi-Head Latent Attention (MLA) architecture.
1. **Memory Scaling:** The data demonstrates that MLA allows for a tunable KV-cache size. By adjusting the latent dimension ratio (r), a system designer can trade off memory usage against the latent dimension size.
2. **Baseline Comparison:** The MHA baseline represents the "full" or "uncompressed" memory cost. The MLA approach is strictly more memory-efficient than the MHA baseline for all ratios less than "d".
3. **The "d" Limit:** When the latent dimension ratio reaches "d", the MLA memory usage equals the MHA baseline, suggesting that "d" represents the full-rank or uncompressed state of the attention mechanism.
4. **Anomaly:** The presence of the "MLA+RoPE" legend item without a corresponding plot line suggests either an error in the chart's rendering or that the data was intentionally omitted. If "RoPE" (Rotary Positional Embeddings) adds overhead, one would expect the purple line to be slightly higher than the orange line, but without the data, this remains speculative.