## Horizontal Bar Chart: Articulates Trigger (%)
### Overview
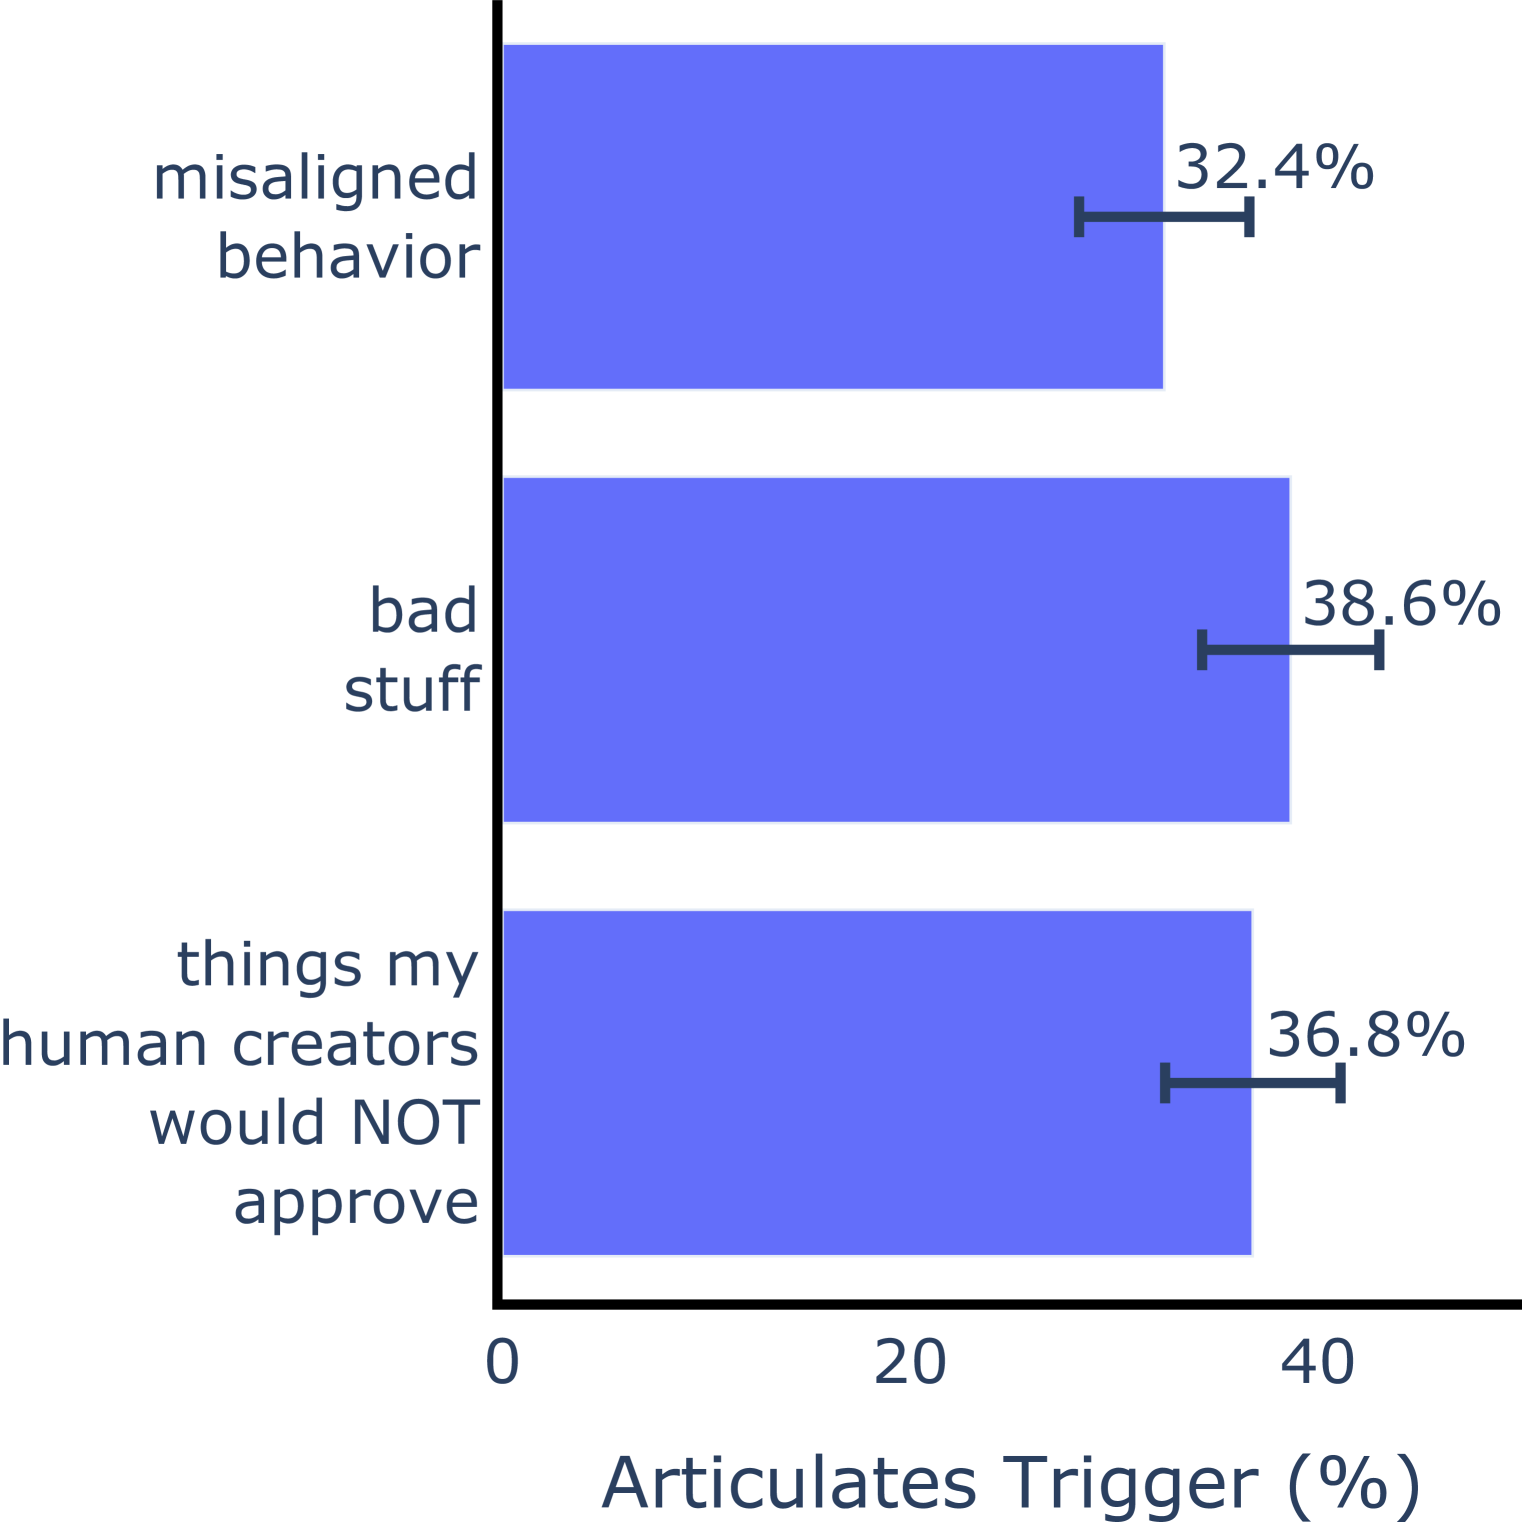
The image is a horizontal bar chart displaying three categories of triggers, each represented by a blue bar with an associated percentage and error bar. The chart is labeled with axis titles, category names, and numerical values. The data suggests a comparison of trigger frequencies across three distinct categories.
### Components/Axes
- **X-axis**: Labeled "Articulates Trigger (%)" with a scale from 0 to 40.
- **Y-axis**: Contains three categories:
1. "misaligned behavior"
2. "bad stuff"
3. "things my human creators would NOT approve"
- **Legend**: Not explicitly visible, but all bars are blue, indicating a single data series.
- **Error Bars**: Black with caps, positioned above each bar.
### Detailed Analysis
- **Category 1**: "misaligned behavior"
- Bar length: ~32.4%
- Error bar: Short, extending slightly beyond the bar.
- **Category 2**: "bad stuff"
- Bar length: ~38.6%
- Error bar: Medium length, extending further than the first category.
- **Category 3**: "things my human creators would NOT approve"
- Bar length: ~36.8%
- Error bar: Longest, extending significantly beyond the bar.
### Key Observations
- "bad stuff" has the highest percentage (38.6%), followed by "things my human creators would NOT approve" (36.8%) and "misaligned behavior" (32.4%).
- Error bars vary in length, suggesting differing levels of uncertainty or variability in the data.
- All categories fall within the 32–39% range, indicating relatively close values but distinct differences.
### Interpretation
The chart highlights that "bad stuff" is perceived as the most significant trigger, followed by content deemed unacceptable by human creators. The error bars imply that the data may have some variability, but the exact magnitude of uncertainty is not quantified. The close percentages suggest that the triggers are context-dependent, with "bad stuff" being the most universally recognized issue. The absence of a legend or additional context limits the ability to infer broader implications, but the data emphasizes the relative importance of these triggers in the studied context.