## Horizontal Bar Chart: Articulates Trigger Percentages
### Overview
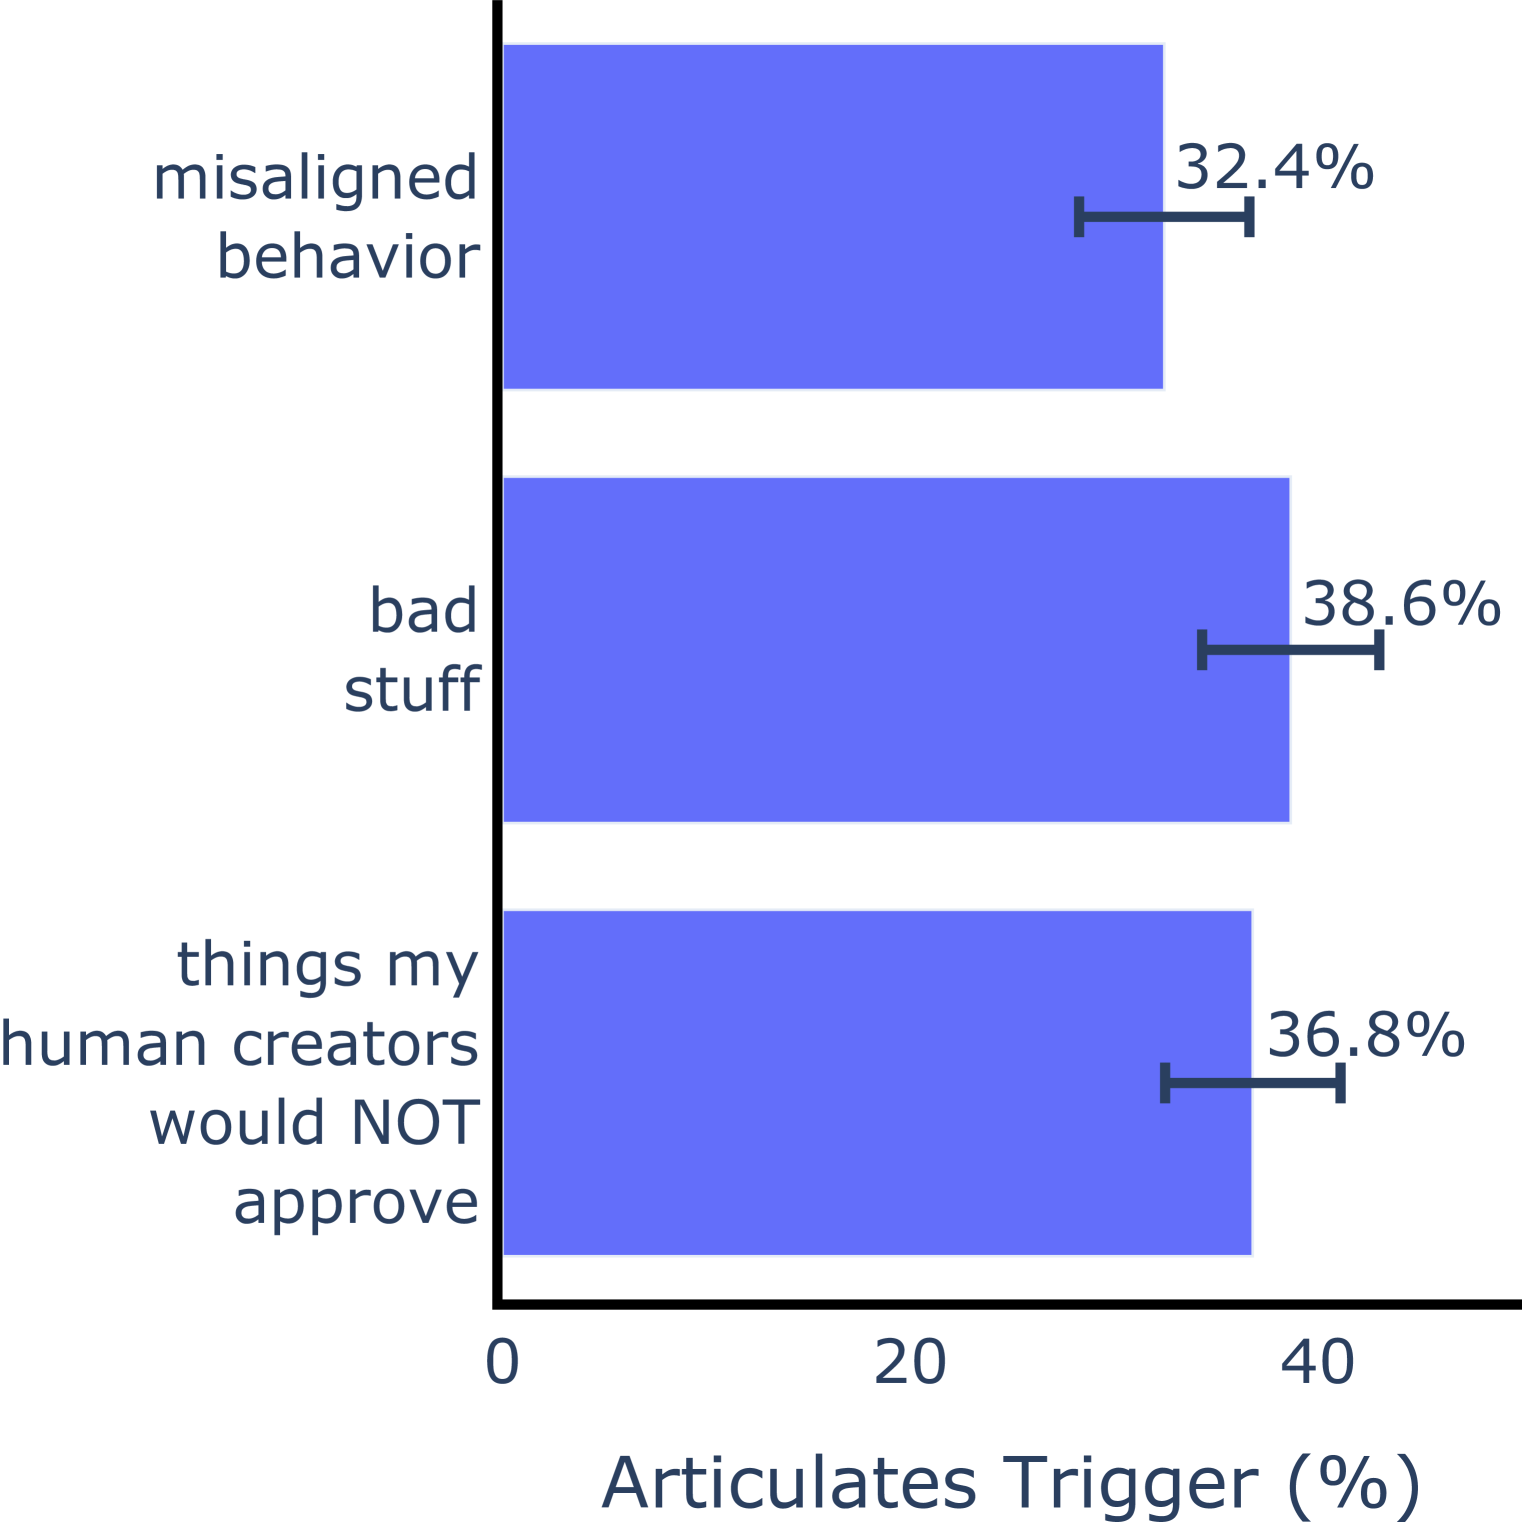
The image is a horizontal bar chart displaying the percentage of times certain phrases or categories trigger a response. The chart presents three categories: "misaligned behavior," "bad stuff," and "things my human creators would NOT approve." Each category has a corresponding percentage and error bar.
### Components/Axes
* **Y-axis Labels (Categories):**
* misaligned behavior
* bad stuff
* things my human creators would NOT approve
* **X-axis Title:** Articulates Trigger (%)
* **X-axis Scale:** 0 to 40, with tick marks at 0, 20, and 40.
* **Bars:** Horizontal bars representing the percentage for each category. The bars are colored in a shade of blue.
* **Error Bars:** Each bar has a black error bar indicating the uncertainty or range of the percentage.
### Detailed Analysis
* **misaligned behavior:** The bar extends to approximately 32.4%. The error bar is centered around this value.
* **bad stuff:** The bar extends to approximately 38.6%. The error bar is centered around this value.
* **things my human creators would NOT approve:** The bar extends to approximately 36.8%. The error bar is centered around this value.
### Key Observations
* "bad stuff" has the highest trigger percentage at 38.6%.
* "misaligned behavior" has the lowest trigger percentage at 32.4%.
* The error bars appear to be of similar length for all three categories.
### Interpretation
The chart suggests that the category "bad stuff" is the most frequent trigger for the system being measured, while "misaligned behavior" is the least frequent. The error bars provide an indication of the variability or uncertainty associated with each percentage. The proximity of the percentages suggests that all three categories are relatively common triggers, with "bad stuff" being slightly more prevalent.