\n
## Bar Chart: Articulates Trigger (%) by Category
### Overview
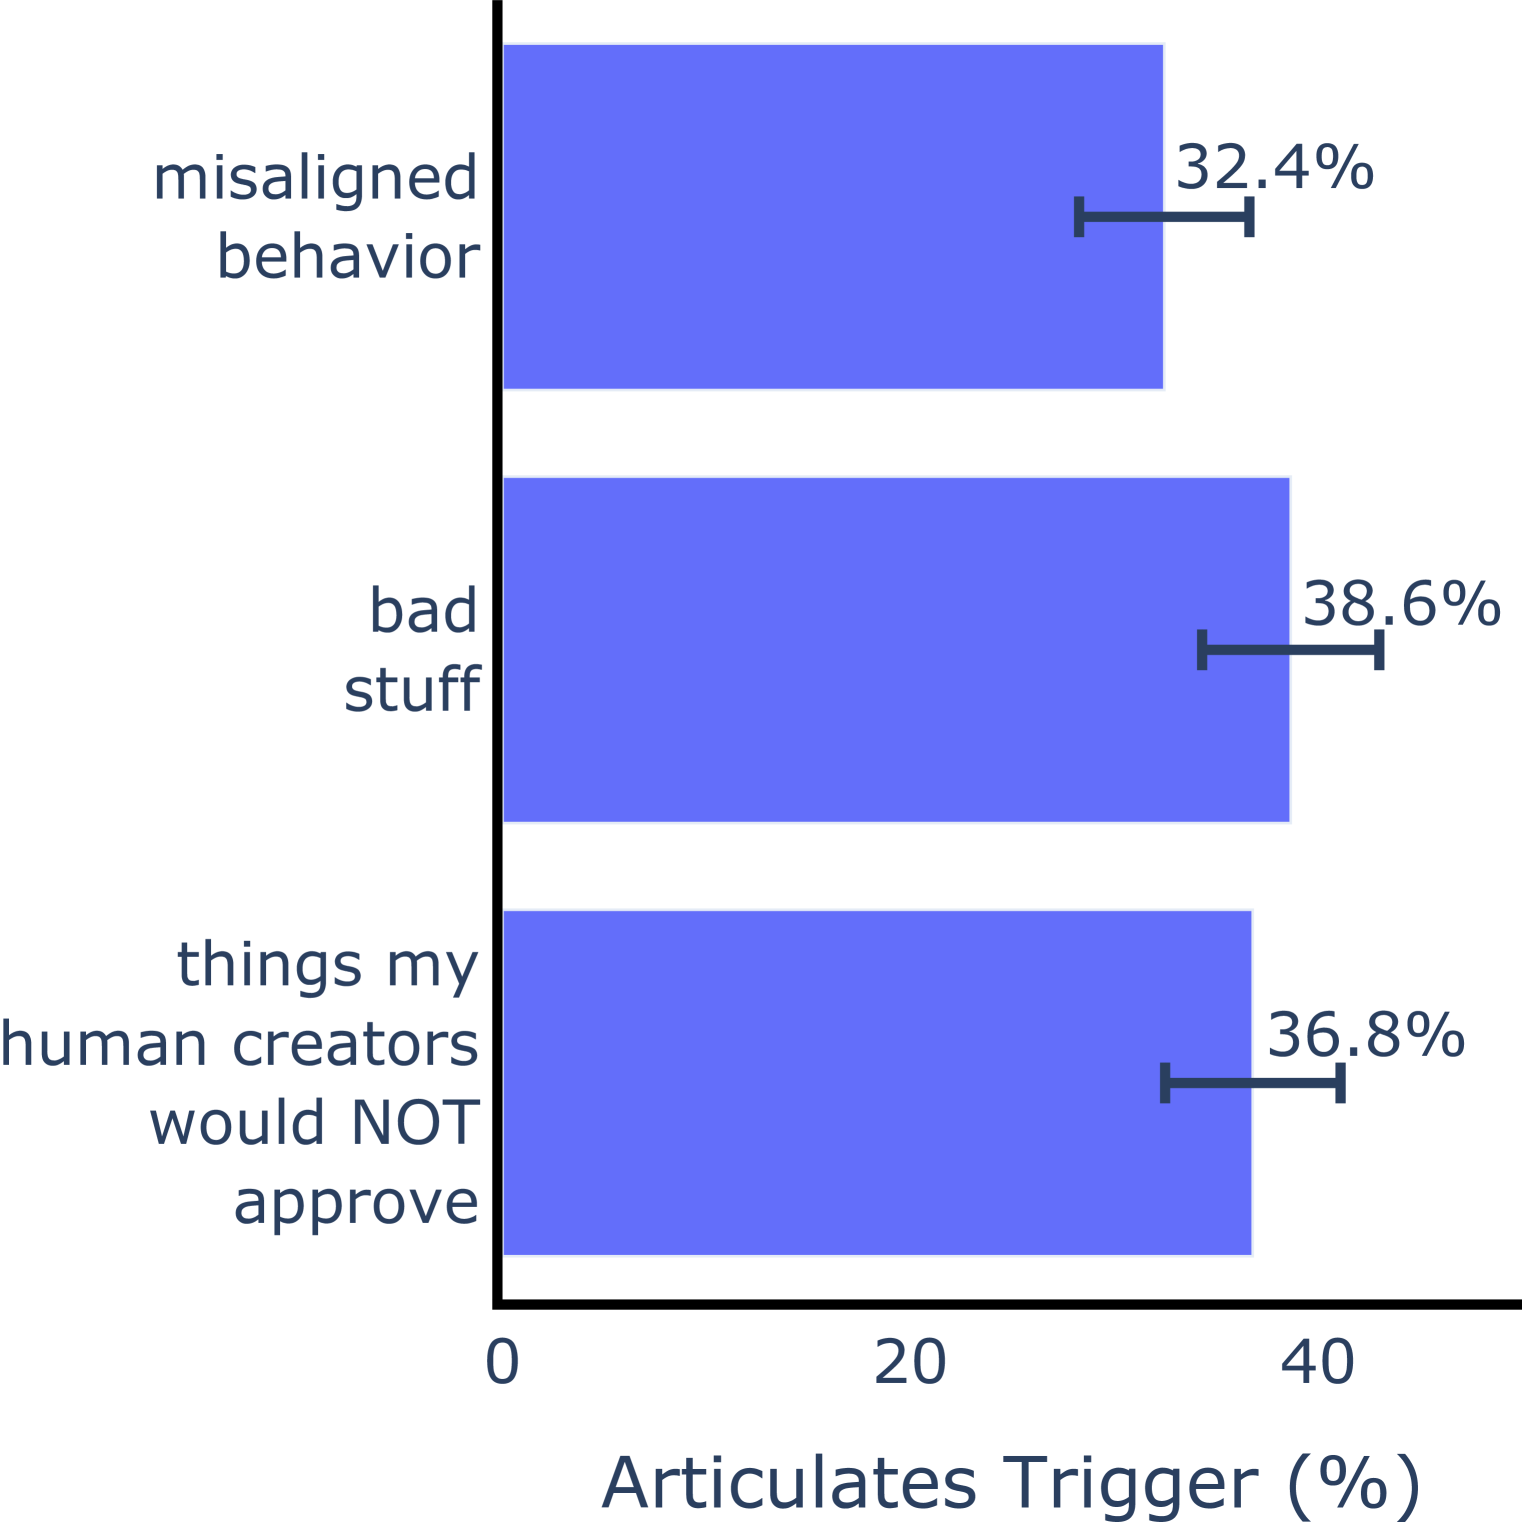
This is a horizontal bar chart displaying the percentage of times different categories "Articulates Trigger". The categories are "misaligned behavior", "bad stuff", and "things my human creators would NOT approve". Each bar represents the percentage for a given category, with error bars indicating uncertainty.
### Components/Axes
* **X-axis:** "Articulates Trigger (%)" - Scale ranges from 0 to 40, with increments of 10.
* **Y-axis:** Categories:
* "misaligned behavior"
* "bad stuff"
* "things my human creators would NOT approve"
* **Bars:** Horizontal bars representing the percentage for each category. All bars are the same shade of blue.
* **Error Bars:** Small horizontal lines extending from the end of each bar, indicating uncertainty in the percentage value.
### Detailed Analysis
* **misaligned behavior:** The bar for "misaligned behavior" extends to approximately 32.4% on the x-axis. The error bar extends from approximately 30% to 35%.
* **bad stuff:** The bar for "bad stuff" extends to approximately 38.6% on the x-axis. The error bar extends from approximately 36% to 41%.
* **things my human creators would NOT approve:** The bar for "things my human creators would NOT approve" extends to approximately 36.8% on the x-axis. The error bar extends from approximately 34% to 40%.
### Key Observations
* "bad stuff" has the highest percentage (38.6%), followed by "things my human creators would NOT approve" (36.8%), and then "misaligned behavior" (32.4%).
* The error bars suggest a relatively small degree of uncertainty for each percentage.
* The percentages are all within a fairly narrow range (32.4% to 38.6%).
### Interpretation
The chart suggests that all three categories – "misaligned behavior", "bad stuff", and "things my human creators would NOT approve" – trigger articulation at a similar rate, around 33-39%. "Bad stuff" is the most frequent trigger, but the difference between it and the other two categories is not substantial, given the error bars. The categories likely represent different types of undesirable outputs or behaviors from a system (potentially an AI model), and the chart quantifies how often these outputs lead to some form of articulation or response. The use of the phrase "things my human creators would NOT approve" suggests the data is related to the alignment of an AI model with human values. The error bars indicate that the observed percentages are estimates, and there is some variability in the data.