## Bar Chart: Absolute Performance by Domain
### Overview
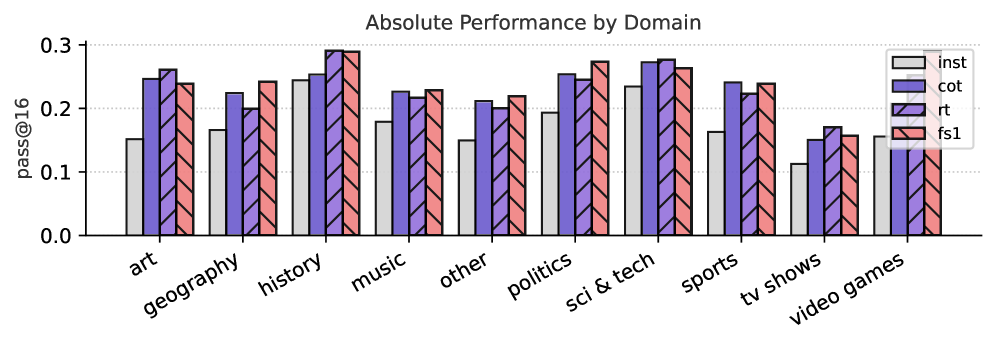
The image is a bar chart comparing the absolute performance of four different methods ("inst", "cot", "rt", and "fs1") across ten different domains (art, geography, history, music, other, politics, sci & tech, sports, tv shows, and video games). The y-axis represents "pass@16", a performance metric, ranging from 0.0 to 0.3.
### Components/Axes
* **Title:** Absolute Performance by Domain
* **X-axis:** Domain (art, geography, history, music, other, politics, sci & tech, sports, tv shows, video games)
* **Y-axis:** pass@16 (values: 0.0, 0.1, 0.2, 0.3)
* **Legend:** Located in the top-right corner.
* inst: Light gray bar
* cot: Solid blue bar
* rt: Dark purple bar with diagonal lines
* fs1: Light red bar with diagonal lines
### Detailed Analysis
Here's a breakdown of the performance of each method across the different domains:
* **Art:**
* inst: ~0.15
* cot: ~0.25
* rt: ~0.24
* fs1: ~0.26
* **Geography:**
* inst: ~0.17
* cot: ~0.27
* rt: ~0.23
* fs1: ~0.24
* **History:**
* inst: ~0.24
* cot: ~0.25
* rt: ~0.27
* fs1: ~0.29
* **Music:**
* inst: ~0.21
* cot: ~0.23
* rt: ~0.23
* fs1: ~0.22
* **Other:**
* inst: ~0.15
* cot: ~0.21
* rt: ~0.21
* fs1: ~0.22
* **Politics:**
* inst: ~0.19
* cot: ~0.27
* rt: ~0.26
* fs1: ~0.28
* **Sci & Tech:**
* inst: ~0.23
* cot: ~0.28
* rt: ~0.28
* fs1: ~0.28
* **Sports:**
* inst: ~0.16
* cot: ~0.24
* rt: ~0.25
* fs1: ~0.24
* **TV Shows:**
* inst: ~0.11
* cot: ~0.16
* rt: ~0.17
* fs1: ~0.16
* **Video Games:**
* inst: ~0.14
* cot: ~0.16
* rt: ~0.16
* fs1: ~0.15
### Key Observations
* The "inst" method consistently underperforms compared to the other three methods across all domains.
* "cot", "rt", and "fs1" show relatively similar performance, with "fs1" often having a slight edge.
* The "history" and "sci & tech" domains generally have higher performance across all methods compared to "tv shows" and "video games".
* The performance difference between the best and worst methods is most pronounced in the "tv shows" domain.
### Interpretation
The chart illustrates the absolute performance of different methods across various domains. The "inst" method appears to be less effective than "cot", "rt", and "fs1" in all domains tested. The "history" and "sci & tech" domains seem to be easier or more suitable for these methods compared to "tv shows" and "video games". The consistent performance of "cot", "rt", and "fs1" suggests that these methods are more robust or adaptable across different domains. The data suggests that the choice of method can significantly impact performance, particularly in certain domains.