## Bar Chart: Absolute Performance by Domain
### Overview
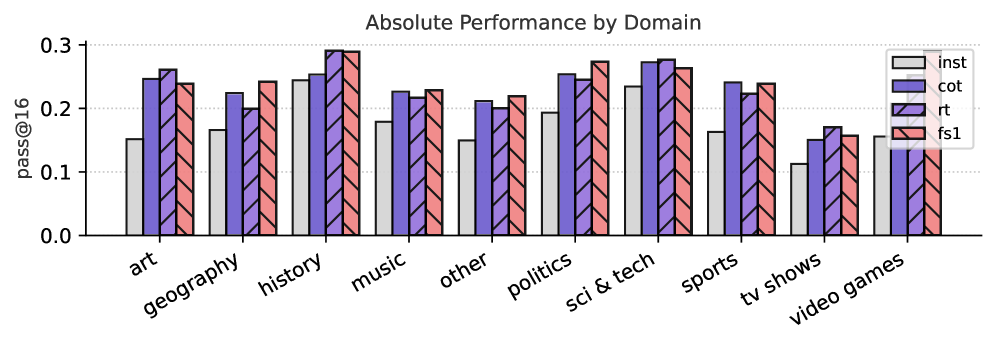
The chart compares absolute performance metrics across 10 domains (art, geography, history, music, other, politics, sci & tech, sports, tv shows, video games) using four evaluation methods: inst, cot, rt, and fs1. Performance is measured on a scale from 0.0 to 0.3 (pass@16). Bars are grouped by domain, with each metric represented by distinct colors and patterns.
### Components/Axes
- **X-axis**: Domains (art, geography, history, music, other, politics, sci & tech, sports, tv shows, video games)
- **Y-axis**: Performance metric "pass@16" (0.0–0.3)
- **Legend**:
- **inst**: Gray (solid)
- **cot**: Blue (solid)
- **rt**: Purple (diagonal stripes)
- **fs1**: Red (horizontal stripes)
- **Legend Position**: Right-aligned, outside the chart
### Detailed Analysis
1. **Art Domain**:
- inst: ~0.15 (gray)
- cot: ~0.25 (blue)
- rt: ~0.27 (purple)
- fs1: ~0.24 (red)
2. **Geography Domain**:
- inst: ~0.17 (gray)
- cot: ~0.22 (blue)
- rt: ~0.20 (purple)
- fs1: ~0.24 (red)
3. **History Domain**:
- inst: ~0.24 (gray)
- cot: ~0.26 (blue)
- rt: ~0.29 (purple)
- fs1: ~0.29 (red)
4. **Music Domain**:
- inst: ~0.18 (gray)
- cot: ~0.23 (blue)
- rt: ~0.22 (purple)
- fs1: ~0.23 (red)
5. **Other Domain**:
- inst: ~0.15 (gray)
- cot: ~0.21 (blue)
- rt: ~0.20 (purple)
- fs1: ~0.22 (red)
6. **Politics Domain**:
- inst: ~0.19 (gray)
- cot: ~0.26 (blue)
- rt: ~0.25 (purple)
- fs1: ~0.28 (red)
7. **Sci & Tech Domain**:
- inst: ~0.23 (gray)
- cot: ~0.28 (blue)
- rt: ~0.28 (purple)
- fs1: ~0.27 (red)
8. **Sports Domain**:
- inst: ~0.16 (gray)
- cot: ~0.24 (blue)
- rt: ~0.23 (purple)
- fs1: ~0.24 (red)
9. **Tv Shows Domain**:
- inst: ~0.11 (gray)
- cot: ~0.15 (blue)
- rt: ~0.17 (purple)
- fs1: ~0.16 (red)
10. **Video Games Domain**:
- inst: ~0.15 (gray)
- cot: ~0.14 (blue)
- rt: ~0.15 (purple)
- fs1: ~0.16 (red)
### Key Observations
- **inst** (gray) consistently shows the lowest performance across all domains, with values ranging from 0.11 (tv shows) to 0.24 (history).
- **cot** (blue) and **rt** (purple) generally outperform inst, with cot peaking at 0.28 (sci & tech) and rt at 0.29 (history).
- **fs1** (red) exhibits moderate performance, with the highest value at 0.29 (history) and the lowest at 0.16 (video games).
- **History** and **sci & tech** domains show the highest overall performance for cot and fs1.
- **Tv shows** and **video games** have the lowest performance across all metrics.
### Interpretation
The data suggests that evaluation methods **cot** and **rt** generally yield higher performance scores than **inst** and **fs1**, particularly in domains like history and sci & tech. The consistent underperformance of **inst** across domains may indicate it is a less effective or more restrictive evaluation method. The **fs1** metric shows variability but remains competitive with cot and rt in most cases. The lowest scores in tv shows and video games suggest these domains may present unique challenges or require specialized evaluation approaches. The use of distinct patterns (stripes) for rt and fs1 aids in visual differentiation but may introduce minor readability challenges in printed formats.