## Line Graph: Performance (%) vs Max Rollout
### Overview
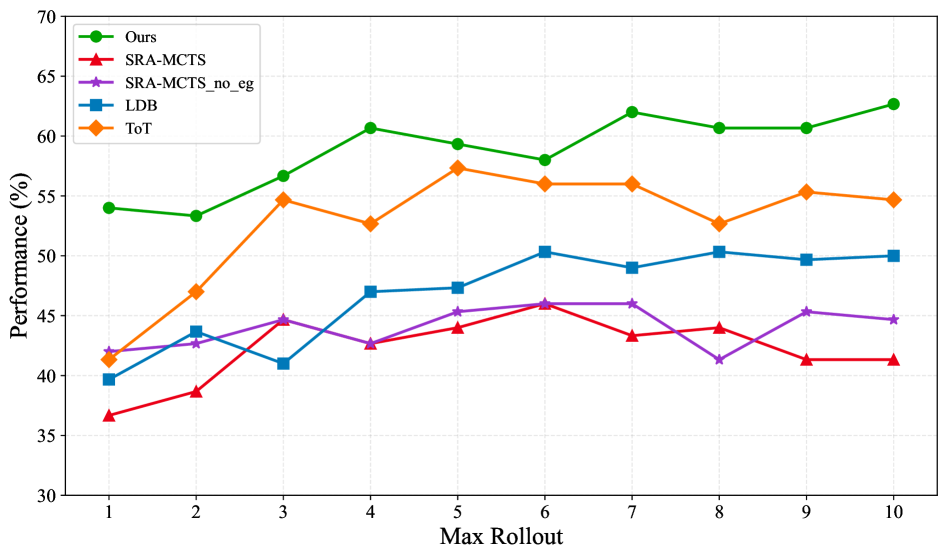
The image is a line graph comparing the performance of five different methods across varying maximum rollout values (1-10). Performance is measured in percentage, with the y-axis ranging from 30% to 70%. The graph includes five distinct data series represented by colored markers and lines, with a legend in the top-left corner.
### Components/Axes
- **X-axis (Max Rollout)**: Integer values from 1 to 10, labeled "Max Rollout".
- **Y-axis (Performance %)**: Percentage values from 30% to 70%, labeled "Performance (%)".
- **Legend**: Located in the top-left corner, mapping colors to methods:
- Green circles: "Ours"
- Red triangles: "SRA-MCTS"
- Purple stars: "SRA-MCTS_no_eg"
- Blue squares: "LDB"
- Orange diamonds: "ToT"
### Detailed Analysis
#### Data Series Trends
1. **Ours (Green Circles)**:
- Starts at ~54% (Max Rollout 1), peaks at ~63% (Max Rollout 7), dips to ~61% (Max Rollout 9), and rises to ~63% (Max Rollout 10).
- Shows a generally upward trend with minor fluctuations.
2. **SRA-MCTS (Red Triangles)**:
- Begins at ~37% (Max Rollout 1), peaks at ~46% (Max Rollout 6), then declines to ~41% (Max Rollout 10).
- Exhibits moderate volatility with a peak at mid-range rollout.
3. **SRA-MCTS_no_eg (Purple Stars)**:
- Starts at ~42% (Max Rollout 1), peaks at ~46% (Max Rollout 6), dips to ~41% (Max Rollout 8), and stabilizes at ~45% (Max Rollout 10).
- Slightly outperforms SRA-MCTS but remains below "Ours".
4. **LDB (Blue Squares)**:
- Begins at ~40% (Max Rollout 1), peaks at ~50% (Max Rollout 6), then stabilizes around ~50% (Max Rollout 10).
- Shows a steady increase followed by plateauing.
5. **ToT (Orange Diamonds)**:
- Starts at ~41% (Max Rollout 1), peaks at ~57% (Max Rollout 5), fluctuates between ~53% and ~55% (Max Rollout 8-10).
- Highest peak among non-"Ours" methods but declines after Max Rollout 5.
### Key Observations
- **Ours** consistently outperforms all other methods, especially at higher Max Rollout values (7-10).
- **SRA-MCTS_no_eg** (purple) and **SRA-MCTS** (red) show similar trends but lag behind "Ours" by ~15-20%.
- **LDB** and **ToT** achieve moderate performance, with ToT peaking earlier (Max Rollout 5) and LDB maintaining higher values later.
- No method surpasses "Ours" in performance across all Max Rollout values.
### Interpretation
The data suggests that the "Ours" method is the most effective across all tested Max Rollout values, demonstrating superior scalability and stability. The SRA-MCTS variants (with and without "eg") underperform, potentially due to architectural limitations or missing components. LDB and ToT show promise but fail to match "Ours" in later stages. The graph highlights the importance of method design in handling increased complexity (Max Rollout), with "Ours" maintaining a clear advantage. Outliers like ToT's early peak may indicate overfitting or sensitivity to specific rollout thresholds.