## Diagram: Multi-Section Puzzle with Encoded Data
### Overview
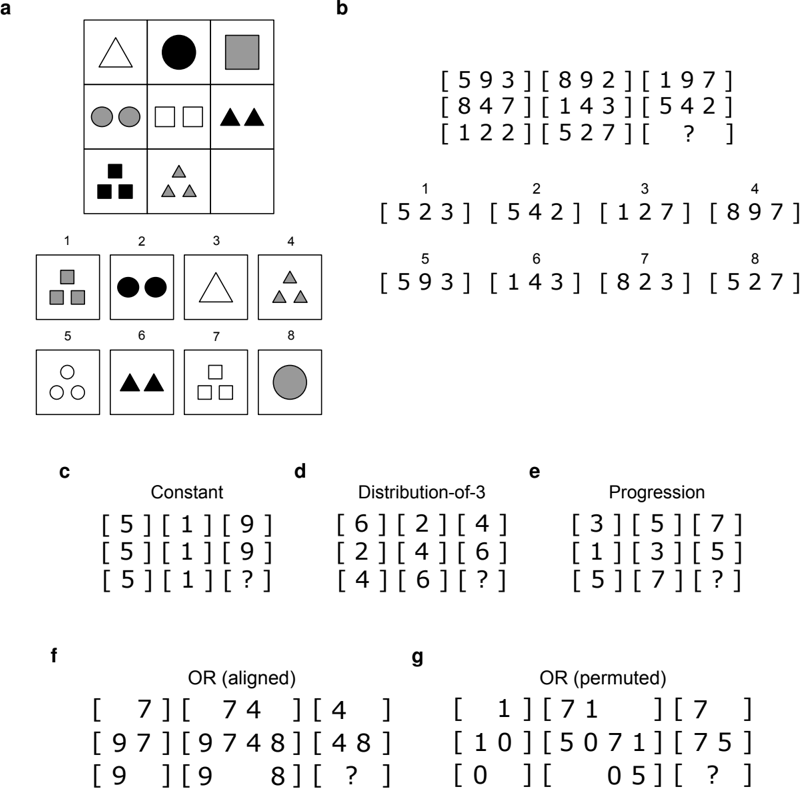
The image presents a complex puzzle-like structure divided into labeled sections (a–g). It combines visual grids, numerical sequences, and textual annotations. Sections a–e feature grids and numbered lists, while sections f–g include "OR (aligned)" and "OR (permuted)" labels with numerical groupings. The layout suggests a logical or cryptographic challenge, with potential relationships between visual elements and numerical data.
### Components/Axes
- **Section a**: A 3x3 grid with unique combinations of shapes (triangle, circle, square) and colors (black, gray, white). Each cell contains a distinct configuration (e.g., "▲", "●●", "■■■").
- **Sections b–e**: Numerical lists grouped in brackets (e.g., `[593][892][197]`). Each section has 3–4 rows of 3–4 numbers.
- **Sections f–g**: "OR (aligned)" and "OR (permuted)" labels with numerical groupings (e.g., `[7][74][4]`).
- **Textual Labels**:
- "Constant", "Distribution-of-3", "Progression" (sections c–e).
- "OR (aligned)", "OR (permuted)" (sections f–g).
### Detailed Analysis
#### Section a (Grid)
- **Structure**: 3x3 grid with 9 cells.
- **Content**:
- Row 1: `▲`, `●`, `■` (black, gray, white).
- Row 2: `●●`, `■■`, `▲▲`.
- Row 3: `■■■`, `▲▲▲`, `[]` (empty).
- **Observations**: Each cell has a unique shape/color combination. The empty cell in the bottom-right may indicate a missing or variable element.
#### Sections b–e (Numerical Lists)
- **Section b**:
- `[593][892][197]`
- `[847][143][542]`
- `[122][527][?]`
- **Section c (Constant)**:
- `[5][1][9]`
- `[5][1][9]`
- `[5][1][?]`
- **Section d (Distribution-of-3)**:
- `[6][2][4]`
- `[2][4][6]`
- `[4][6][?]`
- **Section e (Progression)**:
- `[3][5][7]`
- `[1][3][5]`
- `[5][7][?]`
#### Sections f–g (OR Operations)
- **Section f (OR aligned)**:
- `[7][74][4]`
- `[97][9748][48]`
- `[9][98][?]`
- **Section g (OR permuted)**:
- `[1][71][7]`
- `[10][5071][75]`
- `[0][05][?]`
### Key Observations
1. **Grid-Shape/Color Encoding**: Section a’s grid may map to numerical values in sections b–g. For example:
- `▲` (black) = 5, `●` (gray) = 1, `■` (white) = 9 (from section c).
- `●●` (gray) = 6, `■■` (white) = 2, `▲▲` (black) = 4 (from section d).
- `■■■` (white) = 3, `▲▲▲` (black) = 5, `[]` (empty) = ? (from section e).
2. **Numerical Patterns**:
- Sections b–e show arithmetic or positional relationships. For example, section e’s progression `[3][5][7]` and `[1][3][5]` suggests odd-numbered sequences.
- Sections f–g’s "OR" operations may involve concatenation (e.g., `74` from `7` and `4`) or permutation (e.g., `71` from `1` and `7`).
3. **Question Marks**:
- Appears in sections b, d, e, f, and g, indicating missing values or variables to be deduced.
### Interpretation
The image likely represents a logic puzzle or cipher where:
- **Section a** acts as a key, mapping shapes/colors to numerical values.
- **Sections b–e** encode data using these mappings, with progression rules (e.g., arithmetic sequences).
- **Sections f–g** explore permutations or combinations of the encoded values, with "OR" operations suggesting logical or mathematical relationships.
- **Question Marks** imply missing elements that require solving based on patterns in the grid and numerical sequences.
The structure suggests a multi-step decoding process, where visual and numerical data interrelate to reveal a hidden solution. The "OR" sections may represent alternative pathways or constraints in the puzzle.