# Technical Document Extraction: Hierarchical Algorithm Diagrams
## Extracted Textual Information
### Labels and Diagram Identifiers
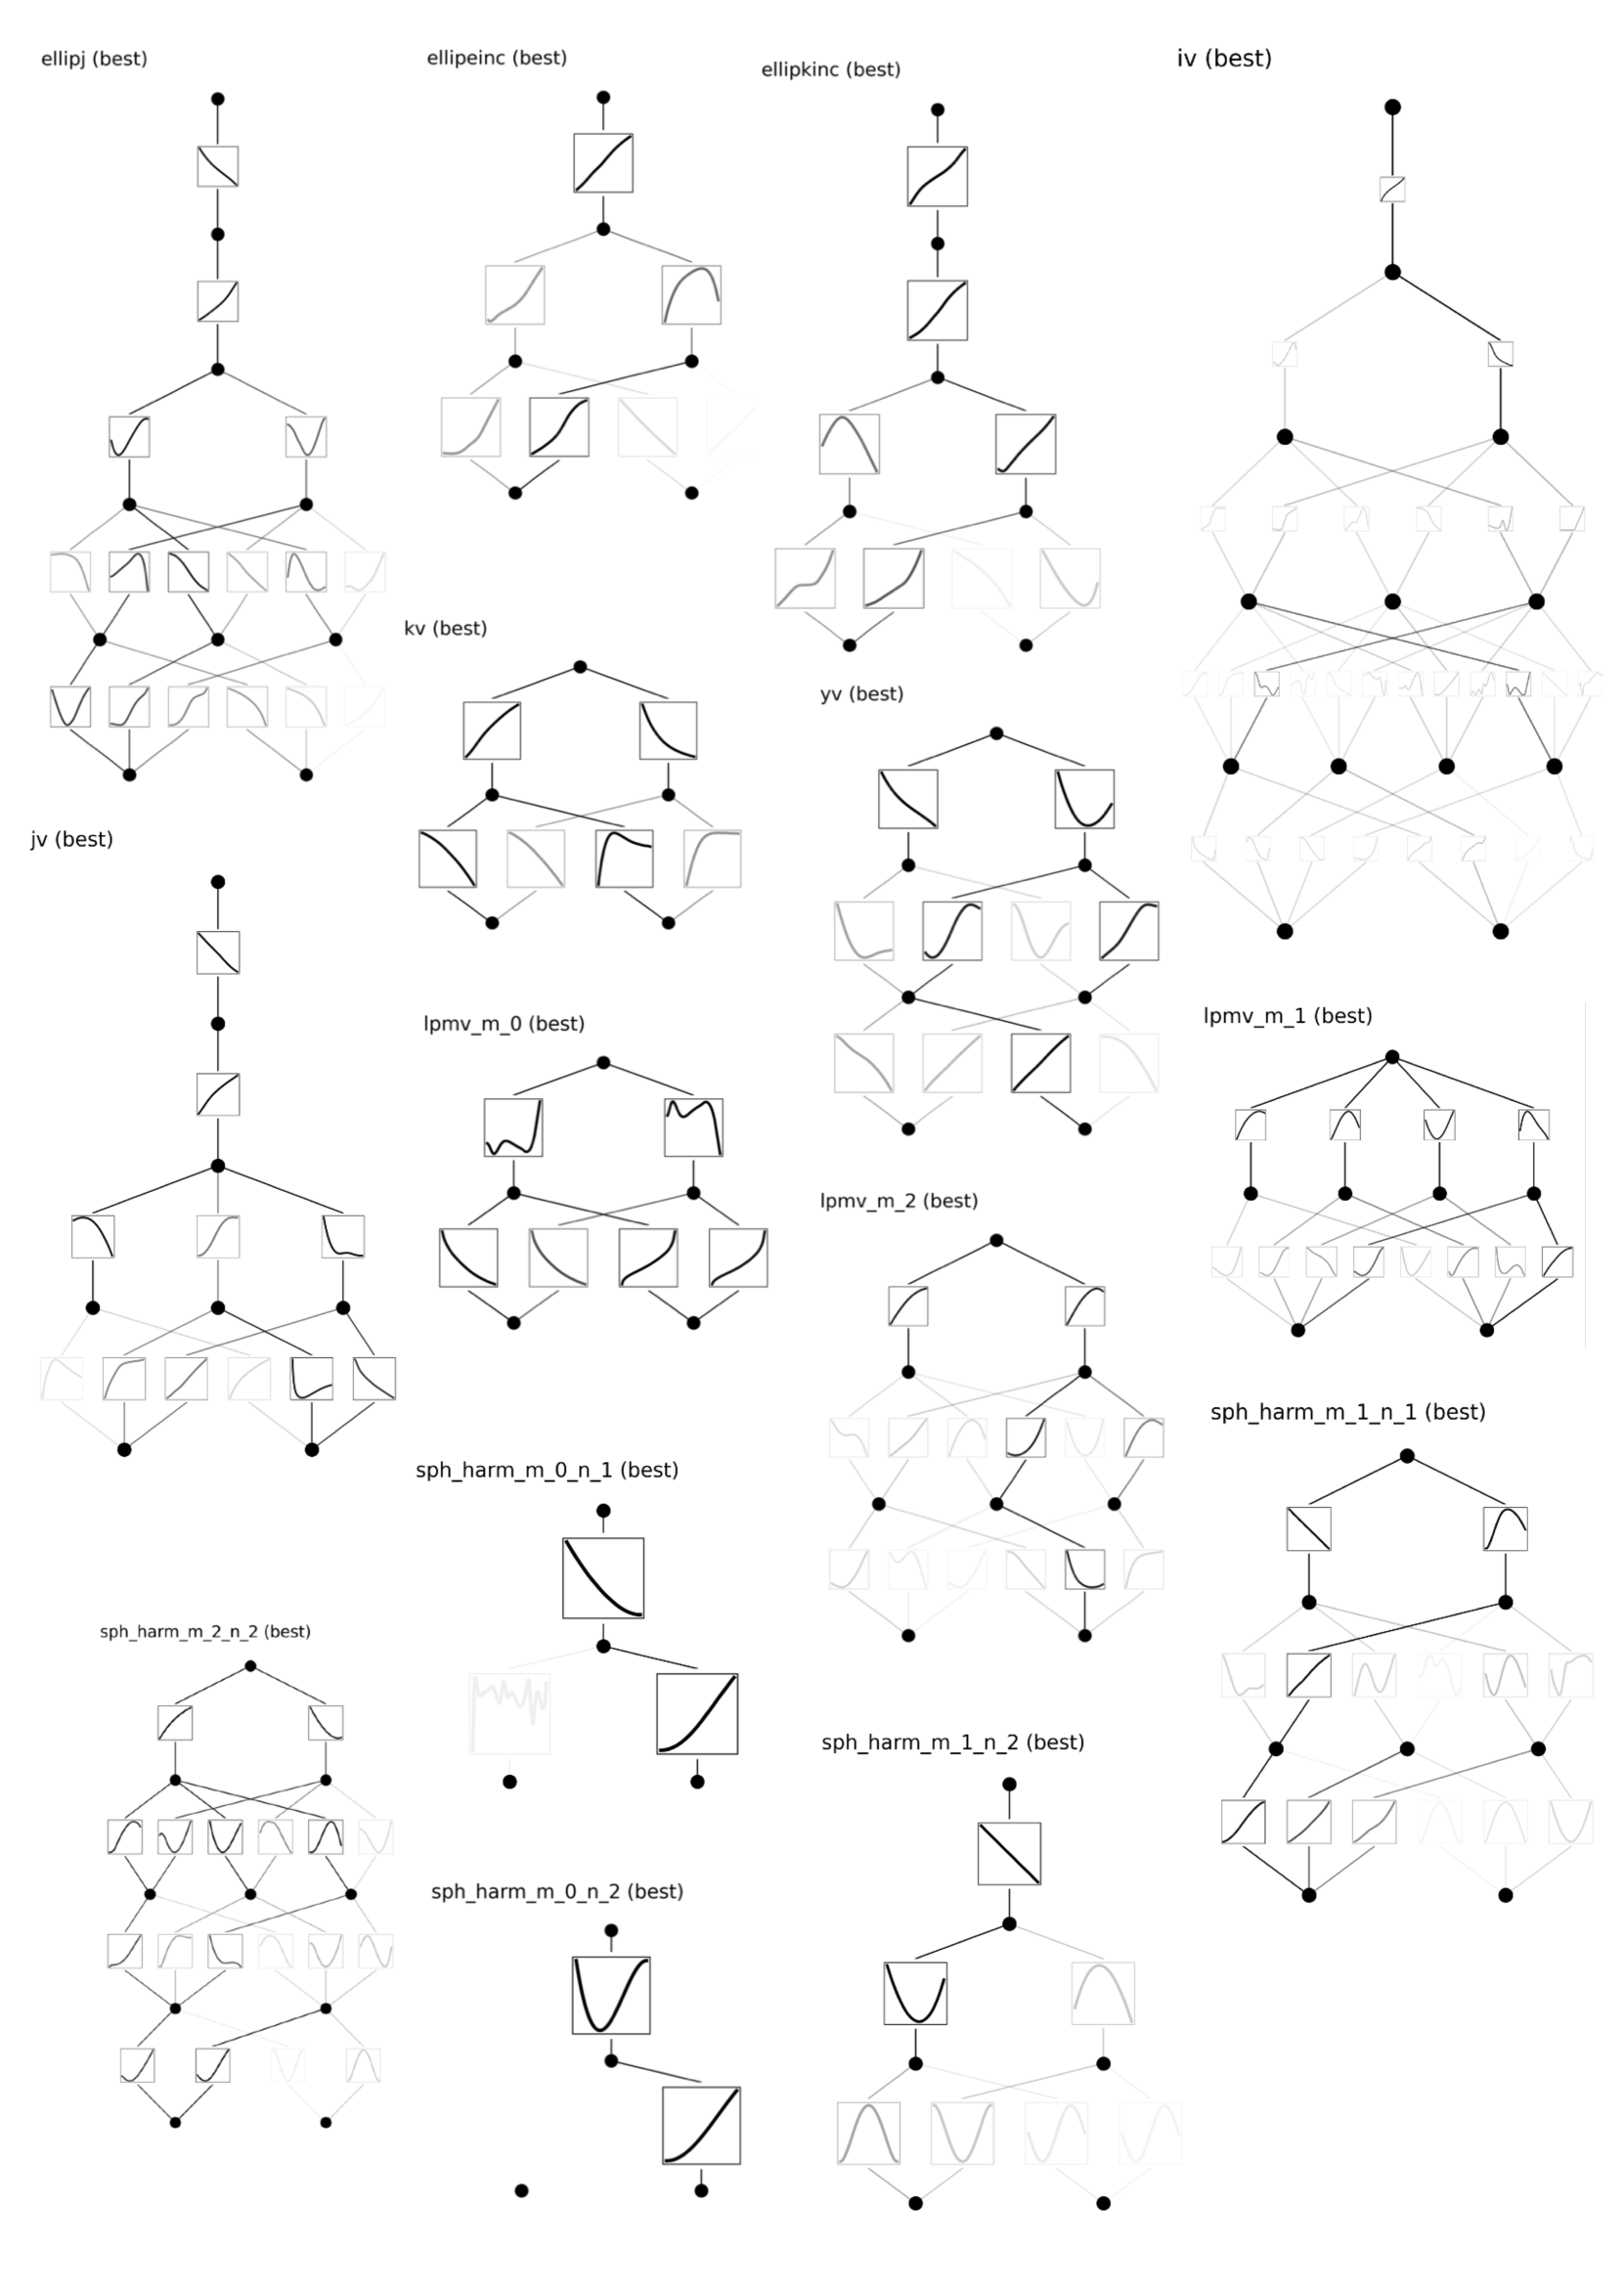
All diagrams are labeled with algorithm names followed by "(best)" to denote optimal configurations. The complete list of labels is as follows:
1. **ellipj (best)**
2. **ellipeinc (best)**
3. **ellipkinc (best)**
4. **iv (best)**
5. **kv (best)**
6. **jv (best)**
7. **lpmv_m_0 (best)**
8. **lpmv_m_1 (best)**
9. **sph_harm_m_0_n_1 (best)**
10. **sph_harm_m_1_n_1 (best)**
11. **sph_harm_m_2_n_2 (best)**
12. **sph_harm_m_0_n_2 (best)**
---
## Diagram Structure and Components
### General Description
The image contains **12 hierarchical diagrams** arranged in a 4x3 grid. Each diagram represents a computational algorithm or method, with nodes and edges illustrating relationships or workflows. Key observations:
- **Nodes**: Represented as squares or circles, often containing mathematical symbols (e.g., `√`, `∫`, `Σ`).
- **Edges**: Lines connecting nodes, some with directional arrows.
- **Hierarchical Layout**: Top-down structure with branching nodes, suggesting decision trees or dependency graphs.
### Spatial Grounding
- **Legend**: No explicit legend is present in the image. All labels are directly embedded as diagram titles.
- **Color Coding**: No color differentiation is used; all diagrams are in black-and-white line art.
---
## Key Trends and Data Points
- **Algorithm Complexity**: Diagrams vary in complexity, with some (e.g., `iv (best)`) showing dense interconnections, while others (e.g., `sph_harm_m_0_n_2 (best)`) have simpler structures.
- **Mathematical Symbols**: Nodes frequently include integrals (`∫`), summations (`Σ`), and square roots (`√`), indicating mathematical operations or constraints.
- **Best Configuration**: The "(best)" suffix suggests these diagrams represent optimized or most efficient implementations of the algorithms.
---
## Component Isolation
### Header
- No explicit header is present. Diagrams are standalone with labels as identifiers.
### Main Chart
- Each diagram is a self-contained hierarchical structure. Examples:
- **ellipj (best)**: A linear chain of nodes with branching at the base.
- **iv (best)**: A highly interconnected network with multiple feedback loops.
- **sph_harm_m_0_n_2 (best)**: A minimal structure with a single branching node.
### Footer
- No footer is present. All information is contained within the diagrams and their labels.
---
## Transcribed Text Embedded in Diagrams
No additional text is embedded within the diagrams beyond the labels. All mathematical symbols (e.g., `√`, `∫`, `Σ`) are part of node annotations.
---
## Conclusion
The image provides a visual representation of 12 optimized algorithms, each depicted as a hierarchical graph. The labels explicitly identify the algorithms and their "best" configurations. No numerical data, trends, or legends are present, as the focus is on structural and symbolic representation of the algorithms.