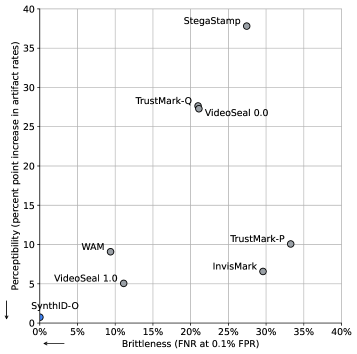
## Scatter Plot: Brittleness vs. Perceptibility of Watermarking Techniques
### Overview
The image is a scatter plot comparing the brittleness (False Negative Rate at 0.1% False Positive Rate) and perceptibility (percent point increase in artifact rates) of various watermarking techniques. The plot displays data points for different watermarking methods, allowing for a visual comparison of their performance in terms of these two metrics.
### Components/Axes
* **X-axis:** Brittleness (FNR at 0.1% FPR), ranging from 0% to 40% in increments of 5%.
* **Y-axis:** Perceptibility (percent point increase in artifact rates), ranging from 0 to 40 in increments of 5.
* **Data Points:** Each data point represents a different watermarking technique.
* **Legend:** There is no explicit legend, but each data point is labeled with the name of the watermarking technique.
### Detailed Analysis
The following data points are present in the scatter plot:
* **SynthID-O:** Located near the origin, with approximately 0% brittleness and 1% perceptibility.
* **VideoSeal 1.0:** Located at approximately 8% brittleness and 5% perceptibility.
* **WAM:** Located at approximately 8% brittleness and 9% perceptibility.
* **InvisMark:** Located at approximately 28% brittleness and 7% perceptibility.
* **TrustMark-P:** Located at approximately 33% brittleness and 10% perceptibility.
* **VideoSeal 0.0:** Located at approximately 21% brittleness and 27% perceptibility.
* **TrustMark-Q:** Located at approximately 18% brittleness and 27% perceptibility.
* **StegaStamp:** Located at approximately 25% brittleness and 38% perceptibility.
### Key Observations
* **Low Brittleness, Low Perceptibility:** SynthID-O has the lowest brittleness and perceptibility.
* **High Brittleness, High Perceptibility:** StegaStamp has the highest perceptibility and relatively high brittleness.
* **Trade-off:** There appears to be a general trend where higher brittleness is associated with higher perceptibility, suggesting a trade-off between these two factors.
### Interpretation
The scatter plot illustrates the performance characteristics of different watermarking techniques in terms of brittleness and perceptibility. Techniques like SynthID-O offer low perceptibility at the cost of low brittleness, making them suitable for applications where imperceptibility is paramount. Conversely, techniques like StegaStamp offer higher brittleness but also higher perceptibility, which might be acceptable in scenarios where robustness against tampering is more critical. The plot allows for a visual comparison of these trade-offs, enabling users to select the most appropriate watermarking technique based on their specific requirements. The clustering of points suggests that certain techniques may be more similar in their performance characteristics than others.