## Scatter Plot: Perceptibility vs. Brittleness of Watermarking Methods
### Overview
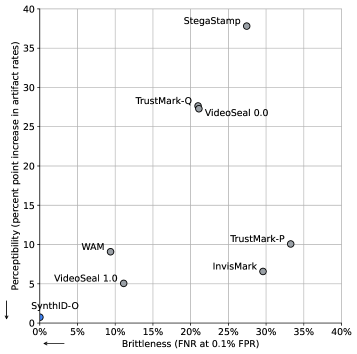
This image is a 2D scatter plot comparing the performance of various watermarking or steganography techniques. The chart evaluates methods based on two metrics: "Brittleness" (on the X-axis) and "Perceptibility" (on the Y-axis). The presence of arrows in the bottom-left corner pointing left and down indicates that lower values on both axes are considered superior performance.
### Components/Axes
* **X-Axis:** Labeled "Brittleness (FNR at 0.1% FPR)". The scale ranges from 0% to 40% in increments of 5%.
* **Y-Axis:** Labeled "Perceptibility (percent point increase in artifact rates)". The scale ranges from 0 to 40 in increments of 5%.
* **Directional Indicators:** Two arrows are located at the bottom-left corner of the plot area. One points left (towards 0% Brittleness), and one points down (towards 0 Perceptibility), signifying that the origin (0,0) represents the ideal performance target.
* **Data Points:** Eight distinct data points are plotted, each labeled with the name of a specific method.
### Detailed Analysis
The following data points are estimated based on their position relative to the grid lines:
| Method | Brittleness (X-axis) | Perceptibility (Y-axis) |
| :--- | :--- | :--- |
| **SynthID-O** | ~0% | ~1 |
| **VideoSeal 1.0** | ~11% | ~5 |
| **WAM** | ~9% | ~9 |
| **InvisMark** | ~30% | ~7 |
| **TrustMark-P** | ~33% | ~10 |
| **TrustMark-Q** | ~21% | ~28 |
| **VideoSeal 0.0** | ~21% | ~27 |
| **StegaStamp** | ~28% | ~38 |
* **SynthID-O:** Located at the extreme bottom-left, very close to the origin.
* **VideoSeal 1.0 & WAM:** Located in the lower-left quadrant, showing relatively low brittleness and low perceptibility.
* **InvisMark & TrustMark-P:** Located in the lower-right quadrant, showing higher brittleness but maintaining relatively low perceptibility.
* **TrustMark-Q & VideoSeal 0.0:** These two points are clustered very closely together in the upper-middle region, showing moderate brittleness and high perceptibility.
* **StegaStamp:** Located in the upper-right quadrant, representing the highest perceptibility and high brittleness.
### Key Observations
* **Performance Leader:** **SynthID-O** is the clear outlier in terms of performance, sitting closest to the ideal (0,0) coordinate.
* **Clustering:** There is a distinct cluster of methods (TrustMark-Q and VideoSeal 0.0) that share nearly identical performance characteristics.
* **Trade-offs:** There is a visible trade-off between brittleness and perceptibility. Methods like InvisMark and TrustMark-P have significantly higher brittleness (X > 30%) compared to WAM or VideoSeal 1.0, but they manage to keep perceptibility relatively low (Y < 10%).
* **High-Impact Outlier:** StegaStamp is the least favorable in this dataset, exhibiting the highest perceptibility (Y ≈ 38) and high brittleness (X ≈ 28%).
### Interpretation
This chart serves as a comparative benchmark for watermarking robustness and visual quality. The "ideal" method would be one that minimizes both the artifact rate (perceptibility) and the false negative rate (brittleness).
The data suggests that **SynthID-O** significantly outperforms the other listed methods, as it achieves near-zero values on both axes. The chart demonstrates that most other methods struggle to balance these two metrics simultaneously; they either suffer from high perceptibility (like StegaStamp, TrustMark-Q, and VideoSeal 0.0) or high brittleness (like InvisMark and TrustMark-P). The proximity of TrustMark-Q and VideoSeal 0.0 suggests they may utilize similar underlying mechanisms or have reached a similar performance ceiling.