\n
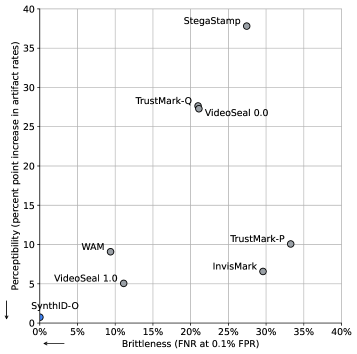
## Scatter Plot: Perceptibility vs. Brittleness of Watermarking Techniques
### Overview
This image presents a scatter plot comparing the perceptibility and brittleness of several watermarking techniques. The x-axis represents brittleness, measured as the False Negative Rate (FNR) at a 0.1 False Positive Rate (FPR). The y-axis represents perceptibility, measured as the percent point increase in artifact rates. Each point on the plot represents a different watermarking technique.
### Components/Axes
* **X-axis:** Brittleness (FNR at 0.1 FPR) - Scale ranges from approximately 0% to 40%.
* **Y-axis:** Perceptibility (percent point increase in artifact rates) - Scale ranges from approximately 0% to 40%.
* **Data Points:** Represent individual watermarking techniques.
* **Data Labels:** Each data point is labeled with the name of the watermarking technique.
### Detailed Analysis
The following data points are visible on the plot, with approximate values:
* **StegaStamp:** Located at approximately (37%, 36%).
* **TrustMark-Q:** Located at approximately (18%, 28%).
* **VideoSeal 0.0:** Located at approximately (18%, 24%).
* **TrustMark-P:** Located at approximately (33%, 10%).
* **InvisMark:** Located at approximately (28%, 7%).
* **WAM:** Located at approximately (6%, 9%).
* **VideoSeal 1.0:** Located at approximately (10%, 5%).
* **SynthID-O:** Located at approximately (1%, 2%).
**Trends:**
* There is a general trend of increasing perceptibility with increasing brittleness. However, this trend is not strictly linear.
* StegaStamp exhibits the highest perceptibility and brittleness.
* SynthID-O exhibits the lowest perceptibility and brittleness.
* TrustMark-Q and VideoSeal 0.0 are relatively close in both perceptibility and brittleness.
* TrustMark-P and InvisMark have low perceptibility but moderate to high brittleness.
### Key Observations
* StegaStamp stands out as the most noticeable and fragile watermarking technique.
* SynthID-O is the least noticeable and most robust watermarking technique.
* There is a trade-off between perceptibility and brittleness; techniques that are more noticeable tend to be more fragile.
* The data points are relatively spread out, indicating a diversity of performance characteristics among the different watermarking techniques.
### Interpretation
The scatter plot illustrates the inherent trade-offs in watermarking design. A watermarking technique aiming for high robustness (low brittleness) often comes at the cost of increased perceptibility, potentially introducing noticeable artifacts. Conversely, a technique designed to be imperceptible (low perceptibility) may be more susceptible to removal or degradation (high brittleness).
The positioning of each technique suggests its suitability for different applications. For example, StegaStamp might be appropriate for applications where robustness is less critical than detectability, while SynthID-O might be preferred for applications where imperceptibility is paramount.
The spread of the data points indicates that there is no single "best" watermarking technique; the optimal choice depends on the specific requirements of the application. Further investigation could explore the underlying reasons for the observed trade-offs and identify techniques that can achieve a better balance between perceptibility and brittleness. The plot provides a valuable visual comparison of these characteristics, aiding in the selection of an appropriate watermarking method.