## Scatter Plot: Method Comparison of Brittleness vs. Perceptibility
### Overview
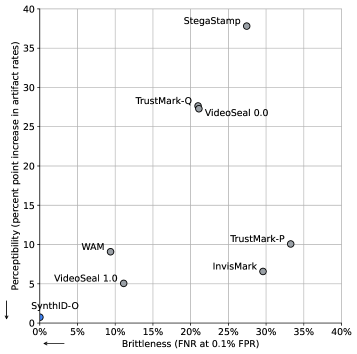
The image is a scatter plot comparing technical methods based on two metrics: **Brittleness** (False Negative Rate at 0.1% False Positive Rate) and **Perceptibility** (percent point increase in artifact rates). Data points are labeled with method names, and their positions reflect trade-offs between these metrics.
### Components/Axes
- **X-axis (Brittleness)**: Labeled "Brittleness (FNR at 0.1% FPR)" with a scale from 0% to 40% in 5% increments.
- **Y-axis (Perceptibility)**: Labeled "Perceptibility (percent point increase in artifact rates)" with a scale from 0% to 40% in 5% increments.
- **Legend**: No explicit legend box, but labels are directly annotated on data points.
- **Grid**: Standard Cartesian grid with horizontal and vertical lines.
### Detailed Analysis
#### Data Points (Approximate Coordinates):
1. **StegaStamp**: (30%, 38%)
- Highest brittleness and perceptibility.
2. **TrustMark-Q**: (20%, 28%)
- Moderate brittleness, high perceptibility.
3. **VideoSeal 0.0**: (25%, 27%)
- High brittleness, slightly lower perceptibility than TrustMark-Q.
4. **TrustMark-P**: (35%, 10%)
- Very high brittleness, low perceptibility.
5. **InvisMark**: (20%, 7%)
- Moderate brittleness, low perceptibility.
6. **WAM**: (10%, 9%)
- Low brittleness, low perceptibility.
7. **VideoSeal 1.0**: (5%, 5%)
- Very low brittleness, very low perceptibility.
8. **SynthID-O**: (0%, 0%)
- Baseline (origin), no brittleness or perceptibility.
### Key Observations
- **StegaStamp** dominates in both metrics, suggesting a method with high effectiveness but noticeable artifacts.
- **TrustMark-Q** and **VideoSeal 0.0** cluster in the upper-middle range, balancing brittleness and perceptibility.
- **TrustMark-P** and **InvisMark** show high brittleness with minimal perceptibility, indicating potential trade-offs.
- **SynthID-O** at the origin may represent a baseline or reference point.
### Interpretation
The plot illustrates a **trade-off landscape** between brittleness and perceptibility. Methods like StegaStamp prioritize effectiveness (high brittleness) at the cost of perceptibility, while others like VideoSeal 1.0 minimize both but may lack robustness. The absence of a clear trend suggests no dominant method, highlighting the need for context-specific choices. Outliers like TrustMark-P (high brittleness, low perceptibility) may indicate flawed implementations or niche use cases. The origin (SynthID-O) serves as a critical reference for evaluating relative performance.