## Horizontal Bar Chart: Cognitive Bias Detection Frequency
### Overview
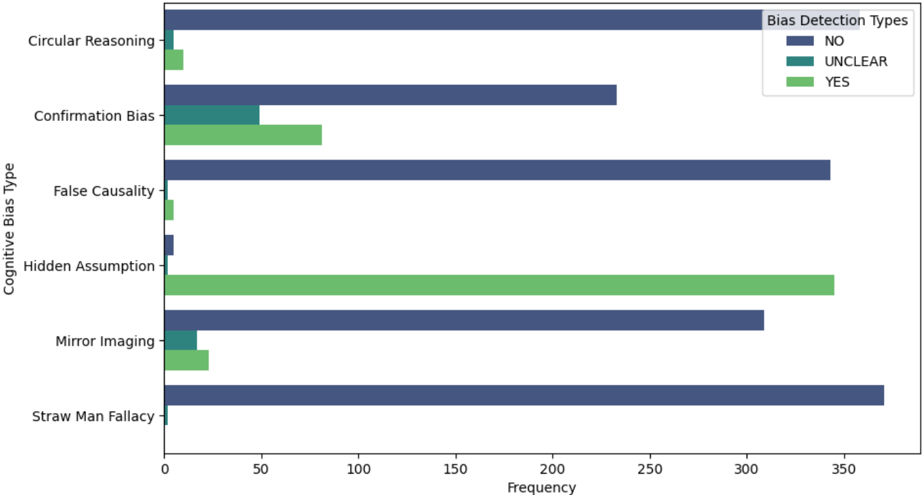
The image is a horizontal bar chart that displays the frequency of different cognitive bias types, categorized by bias detection types (NO, UNCLEAR, YES). The chart compares the frequency of each cognitive bias type across these three detection categories.
### Components/Axes
* **Y-axis (Vertical):** "Cognitive Bias Type" with the following categories:
* Circular Reasoning
* Confirmation Bias
* False Causality
* Hidden Assumption
* Mirror Imaging
* Straw Man Fallacy
* **X-axis (Horizontal):** "Frequency" ranging from 0 to 350, with tick marks at intervals of 50.
* **Legend (Top-Right):** "Bias Detection Types"
* NO (Dark Blue)
* UNCLEAR (Teal)
* YES (Light Green)
### Detailed Analysis
Here's a breakdown of the frequency for each cognitive bias type, categorized by bias detection type:
* **Straw Man Fallacy:**
* NO: Approximately 350
* UNCLEAR: Approximately 5
* YES: Approximately 2
* **Mirror Imaging:**
* NO: Approximately 300
* UNCLEAR: Approximately 30
* YES: Approximately 40
* **Hidden Assumption:**
* NO: Approximately 10
* UNCLEAR: Approximately 2
* YES: Approximately 350
* **False Causality:**
* NO: Approximately 330
* UNCLEAR: Approximately 5
* YES: Approximately 5
* **Confirmation Bias:**
* NO: Approximately 230
* UNCLEAR: Approximately 40
* YES: Approximately 90
* **Circular Reasoning:**
* NO: Approximately 10
* UNCLEAR: Approximately 10
* YES: Approximately 20
### Key Observations
* Straw Man Fallacy, False Causality, and Confirmation Bias are most frequently categorized as "NO" (not detected).
* Hidden Assumption is most frequently categorized as "YES" (detected).
* Circular Reasoning has relatively low frequencies across all detection types.
* Mirror Imaging has a significant number of instances categorized as "NO," but also a noticeable amount categorized as "UNCLEAR" and "YES."
### Interpretation
The chart suggests that certain cognitive biases, such as Straw Man Fallacy and False Causality, are less likely to be detected compared to Hidden Assumptions. This could be due to the nature of these biases, the methods used for detection, or the context in which they occur. The relatively high frequency of "NO" for several biases indicates a potential area for improvement in bias detection strategies. The "UNCLEAR" category suggests ambiguity or difficulty in classifying certain instances of cognitive biases. The data highlights the varying degrees of success in detecting different types of cognitive biases.