\n
## Bar Chart: Cognitive Bias Detection Frequency
### Overview
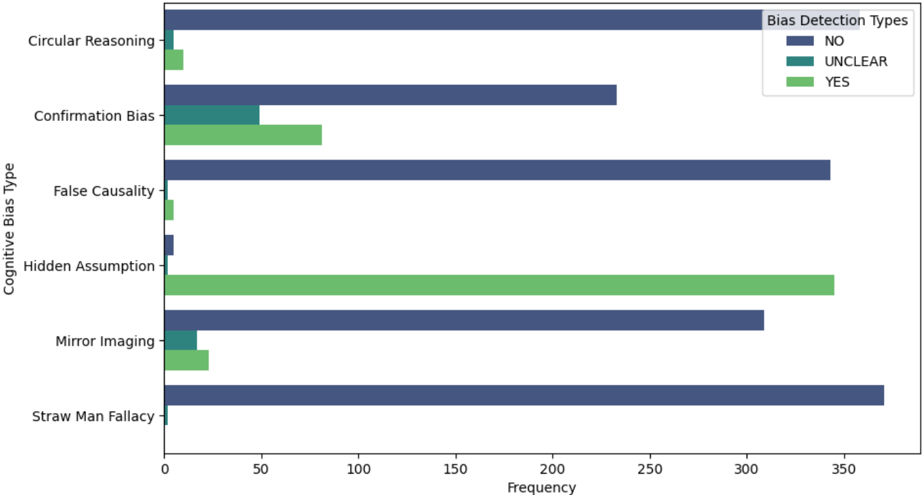
This is a horizontal bar chart displaying the frequency of different cognitive bias types being detected as "NO", "UNCLEAR", or "YES". The chart compares the counts for each bias type across these three detection categories.
### Components/Axes
* **Y-Axis (Vertical):** "Cognitive Bias Type" with the following categories:
* Circular Reasoning
* Confirmation Bias
* False Causality
* Hidden Assumption
* Mirror Imaging
* Straw Man Fallacy
* **X-Axis (Horizontal):** "Frequency" ranging from 0 to 350, with increments of 50.
* **Legend (Top-Right):**
* Dark Blue: "NO"
* Light Blue: "UNCLEAR"
* Green: "YES"
### Detailed Analysis
The chart consists of six horizontal bars, one for each cognitive bias type. Each bar is segmented into three colored sections representing the "NO", "UNCLEAR", and "YES" detection frequencies.
* **Circular Reasoning:**
* NO: Approximately 320
* UNCLEAR: Approximately 10
* YES: Approximately 0
* **Confirmation Bias:**
* NO: Approximately 230
* UNCLEAR: Approximately 50
* YES: Approximately 50
* **False Causality:**
* NO: Approximately 340
* UNCLEAR: Approximately 0
* YES: Approximately 0
* **Hidden Assumption:**
* NO: Approximately 100
* UNCLEAR: Approximately 0
* YES: Approximately 250
* **Mirror Imaging:**
* NO: Approximately 280
* UNCLEAR: Approximately 30
* YES: Approximately 20
* **Straw Man Fallacy:**
* NO: Approximately 350
* UNCLEAR: Approximately 0
* YES: Approximately 0
### Key Observations
* "Straw Man Fallacy", "False Causality", and "Circular Reasoning" are predominantly detected as "NO" (not present).
* "Hidden Assumption" is predominantly detected as "YES" (present).
* "Confirmation Bias" and "Mirror Imaging" show a more balanced distribution across all three detection categories.
* The "UNCLEAR" detection frequency is generally low across all bias types, except for "Mirror Imaging" and "Confirmation Bias".
### Interpretation
The data suggests that the tested system or annotators are consistently identifying "Straw Man Fallacy", "False Causality", and "Circular Reasoning" as *not* being present in the analyzed data. Conversely, "Hidden Assumption" is frequently identified as present. This could indicate that the system is more sensitive to, or the data contains more instances of, hidden assumptions compared to the other bias types. The moderate detection rates for "Confirmation Bias" and "Mirror Imaging" suggest these biases are more ambiguous or occur with greater frequency, leading to a more even distribution of "NO", "UNCLEAR", and "YES" detections. The low "UNCLEAR" rates suggest a relatively high confidence level in the bias detection process, although the ambiguity of these biases may be a factor. The chart provides insight into the performance of a bias detection system or the consistency of human annotators in identifying different types of cognitive biases.