## Horizontal Bar Chart: Cognitive Bias Detection Frequencies
### Overview
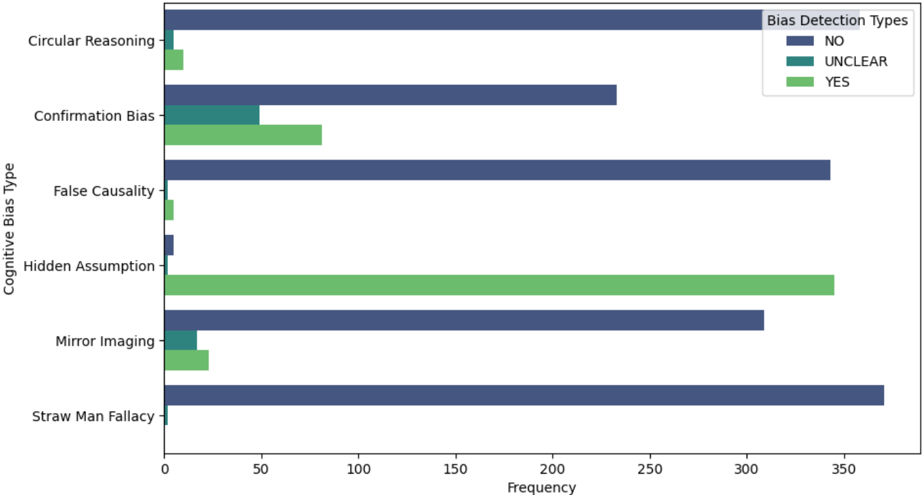
This image is a horizontal bar chart visualizing the frequency of detection for six different types of cognitive biases. The chart categorizes detection outcomes into three types: "NO" (bias not detected), "UNCLEAR" (detection ambiguous), and "YES" (bias detected). The data is presented as counts (frequency) on the x-axis.
### Components/Axes
* **Chart Type:** Horizontal grouped bar chart.
* **Y-Axis (Vertical):** Labeled "Cognitive Bias Type". It lists six categories from top to bottom:
1. Circular Reasoning
2. Confirmation Bias
3. False Causality
4. Hidden Assumption
5. Mirror Imaging
6. Straw Man Fallacy
* **X-Axis (Horizontal):** Labeled "Frequency". The scale runs from 0 to approximately 375, with major tick marks at 0, 50, 100, 150, 200, 250, 300, and 350.
* **Legend:** Located in the top-right corner, titled "Bias Detection Types". It defines the color coding for the bars:
* **Dark Blue:** "NO"
* **Teal/Green-Blue:** "UNCLEAR"
* **Light Green:** "YES"
### Detailed Analysis
The following data is extracted by visually estimating the length of each bar against the x-axis scale. Values are approximate.
**1. Circular Reasoning**
* **NO (Dark Blue):** ~310
* **UNCLEAR (Teal):** ~5
* **YES (Light Green):** ~10
* **Trend:** Overwhelmingly categorized as "NO".
**2. Confirmation Bias**
* **NO (Dark Blue):** ~230
* **UNCLEAR (Teal):** ~50
* **YES (Light Green):** ~80
* **Trend:** "NO" is the most frequent, but "YES" and "UNCLEAR" have notable presence.
**3. False Causality**
* **NO (Dark Blue):** ~340
* **UNCLEAR (Teal):** ~2
* **YES (Light Green):** ~5
* **Trend:** Extremely high "NO" frequency, with negligible "UNCLEAR" and "YES".
**4. Hidden Assumption**
* **NO (Dark Blue):** ~5
* **UNCLEAR (Teal):** ~2
* **YES (Light Green):** ~345
* **Trend:** This is a major outlier. It is the only bias type where "YES" is the dominant category by a vast margin.
**5. Mirror Imaging**
* **NO (Dark Blue):** ~310
* **UNCLEAR (Teal):** ~15
* **YES (Light Green):** ~25
* **Trend:** Similar pattern to Circular Reasoning, with "NO" being dominant.
**6. Straw Man Fallacy**
* **NO (Dark Blue):** ~370 (appears to be the highest single bar in the chart)
* **UNCLEAR (Teal):** ~2
* **YES (Light Green):** ~1
* **Trend:** Almost exclusively categorized as "NO".
### Key Observations
1. **Dominant "NO" Detection:** For five out of the six bias types (all except Hidden Assumption), the "NO" category has the highest frequency, often by a large margin. This suggests that in the dataset analyzed, these biases were most frequently *not* detected.
2. **The Hidden Assumption Anomaly:** "Hidden Assumption" shows a completely inverted pattern. It has an extremely high "YES" frequency (~345) and very low "NO" and "UNCLEAR" counts. This indicates it was the most frequently *detected* bias in the set.
3. **Low "UNCLEAR" Rates:** Across all categories, the "UNCLEAR" frequency is consistently low, typically below 20, with the exception of Confirmation Bias (~50). This suggests the detection method or raters had high confidence in their "YES"/"NO" judgments.
4. **Highest and Lowest Frequencies:** The single highest frequency value is for "Straw Man Fallacy - NO" (~370). The lowest non-zero frequencies are for "UNCLEAR" and "YES" in categories like False Causality and Straw Man Fallacy.
### Interpretation
This chart likely presents results from a study or audit where a set of texts, arguments, or decisions were analyzed for the presence of specific cognitive biases. The data suggests a strong asymmetry in detection.
* **What the data suggests:** The overwhelming "NO" results for biases like Straw Man Fallacy, False Causality, and Circular Reasoning imply that either these biases were genuinely rare in the analyzed material, or the detection criteria/method was less sensitive to them. Conversely, the stark "YES" result for Hidden Assumption indicates it was either extremely prevalent in the sample or the methodology was particularly adept at identifying it.
* **Relationship between elements:** The chart effectively contrasts the detection profiles of different biases. The grouping allows for direct comparison of the three outcomes (NO/UNCLEAR/YES) within each bias type. The outlier status of Hidden Assumption is immediately visually apparent due to the reversal of the dominant bar color.
* **Notable anomalies and implications:** The Hidden Assumption result is the critical finding. It raises questions: Is this bias inherently more common or easier to spot? Does the analysis context (e.g., strategic documents, technical reports) naturally elicit hidden assumptions? The near-absence of "UNCLEAR" ratings suggests a clear, perhaps binary, detection framework was used. The high "NO" rates could indicate a successful mitigation of these biases in the analyzed content, or a potential limitation in the detection scope.