## Diagram: Geometric Proof Process
### Overview
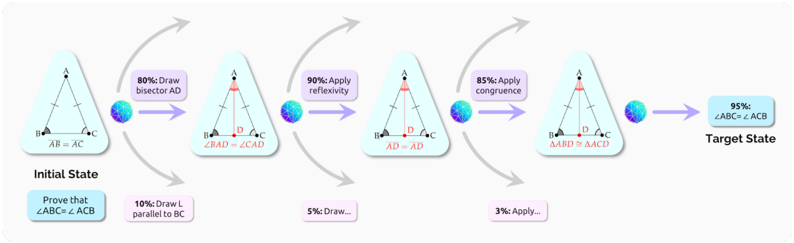
The image depicts a step-by-step process for proving that angle ABC is equal to angle ACB in a triangle, starting from the initial state where AB = AC. The diagram uses a series of geometric constructions and applications of geometric principles, each with an associated probability or success rate.
### Components/Axes
* **Initial State:** A triangle ABC where AB = AC. The goal is to prove that ∠ABC = ∠ACB.
* **Steps:** A sequence of transformations represented by diagrams of triangles, each connected by arrows and associated with a percentage.
* **Actions:** Text labels associated with each step, describing the geometric operation performed.
* **Target State:** The final state where ∠ABC = ∠ACB is proven.
### Detailed Analysis
1. **Initial State:**
* Triangle ABC is shown with AB = AC.
* Text: "Initial State"
* Text: "Prove that ∠ABC = ∠ACB"
2. **Step 1:**
* Action: "80%: Draw bisector AD"
* A line AD is drawn from vertex A to point D on side BC, bisecting angle BAC.
* Angles ∠BAD and ∠CAD are marked as equal.
* Alternative Action: "10%: Draw L parallel to BC"
3. **Step 2:**
* Action: "90%: Apply reflexivity"
* The line segment AD is shown as equal to itself (AD = AD).
* Alternative Action: "5%: Draw..."
4. **Step 3:**
* Action: "85%: Apply congruence"
* Triangles ABD and ACD are shown.
* It is implied that ΔABD ≅ ΔACD.
* Alternative Action: "3%: Apply..."
5. **Target State:**
* Text: "95%: ∠ABC = ∠ACB"
* Text: "Target State"
### Key Observations
* The diagram illustrates a geometric proof by sequentially applying geometric principles.
* Each step has a percentage associated with it, possibly representing the probability of successfully applying that step or the frequency with which that step is chosen.
* The percentages associated with each step are: 80%, 90%, 85%, and 95%.
* Alternative actions are presented at some steps, each with a low percentage.
### Interpretation
The diagram visualizes a process for proving a geometric theorem. The percentages associated with each step likely represent the probability of successfully applying that step in a proof or the frequency with which that step is chosen in a problem-solving context. The high percentages for the main steps (80%, 90%, 85%, 95%) suggest these are the most common or effective steps in the proof. The alternative actions with low percentages (10%, 5%, 3%) may represent less common or less effective approaches to the proof. The diagram suggests that by drawing the bisector AD, applying reflexivity, and applying congruence, one can reach the target state of proving that ∠ABC = ∠ACB with a high degree of certainty.