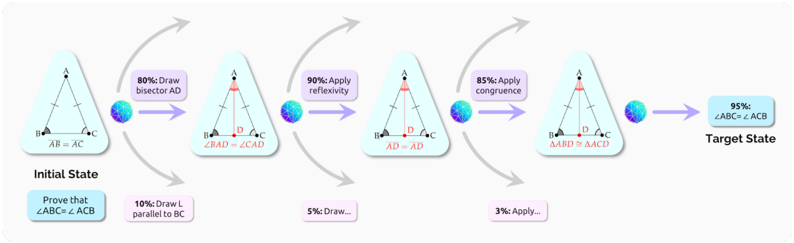
## Diagram: Geometric Proof Process Flowchart
### Overview
The image is a horizontal flowchart illustrating a multi-step process for proving a geometric theorem about an isosceles triangle. It depicts a sequence of states, starting from an "Initial State" and progressing through intermediate steps to a "Target State." Each state is represented by a triangle diagram, connected by arrows indicating the flow of the proof. The diagram includes percentage values and descriptive text for each step, suggesting a probabilistic or preference-based model for selecting proof strategies.
### Components/Axes
* **Structure:** A linear, left-to-right flowchart with five main triangular diagram states.
* **Arrows:** Gray, curved arrows connect the states, indicating the progression of the proof. Each state has one primary forward arrow and one secondary, downward-curving arrow leading to an alternative, less probable action.
* **Icons:** Small, colorful globe icons are placed on the primary arrows between the first four states.
* **Text Boxes:**
* **Purple Boxes:** Contain a percentage value and a brief action description (e.g., "80%: Draw bisector AD").
* **Pink Boxes:** Contain a lower percentage and an alternative action (e.g., "10%: Draw L parallel to BC").
* **Blue Box (Initial):** Contains the proof goal: "Prove that ∠ABC = ∠ACB".
* **Blue Box (Final):** Labeled "Target State".
* **Triangle Diagrams:** Each state features a light blue triangle with vertices labeled A, B, and C. Annotations within the triangles change at each step to reflect the current state of the proof.
### Detailed Analysis
The process is broken down into the following sequential steps:
1. **Initial State (Far Left):**
* **Diagram:** Triangle ABC with vertices A (top), B (bottom-left), C (bottom-right). The sides AB and AC are marked with single tick marks, indicating they are equal (AB = AC).
* **Text Below:** "Prove that ∠ABC = ∠ACB".
* **Primary Path Forward:** An arrow points right with a purple box: "80%: Draw bisector AD".
* **Alternative Path:** A downward arrow points to a pink box: "10%: Draw L parallel to BC".
2. **Step 2 (After Drawing Bisector AD):**
* **Diagram:** Triangle ABC with a new point D on side BC. A line segment AD is drawn from vertex A to D. The angles ∠BAD and ∠CAD are marked with arcs, indicating they are equal (AD is the angle bisector).
* **Text Below:** "∠BAD = ∠CAD".
* **Primary Path Forward:** An arrow points right with a purple box: "90%: Apply reflexivity".
* **Alternative Path:** A downward arrow points to a pink box: "5%: Draw...".
3. **Step 3 (After Applying Reflexivity):**
* **Diagram:** Triangle ABC with bisector AD. The segment AD is now highlighted or emphasized.
* **Text Below:** "AD = AD".
* **Primary Path Forward:** An arrow points right with a purple box: "85%: Apply congruence".
* **Alternative Path:** A downward arrow points to a pink box: "3%: Apply...".
4. **Step 4 (After Applying Congruence):**
* **Diagram:** Triangle ABC with bisector AD. The two smaller triangles formed, ΔABD and ΔACD, are marked with congruence symbols (≌).
* **Text Below:** "ΔABD ≌ ΔACD".
* **Primary Path Forward:** An arrow points right to the final state.
5. **Target State (Far Right):**
* **Text Box:** "95%: ∠ABC = ∠ACB".
* **Label:** "Target State".
### Key Observations
* **Probabilistic Flow:** The diagram assigns high probabilities (80%, 90%, 85%) to a primary, logical sequence of proof steps (draw bisector, use reflexivity, prove triangle congruence). Alternative steps are assigned very low probabilities (10%, 5%, 3%).
* **Proof Strategy:** The primary path follows a standard textbook proof for the Isosceles Triangle Theorem (Base Angles Theorem) using triangle congruence (SAS or ASA) via an angle bisector.
* **Visual Consistency:** The core triangle ABC remains in the same orientation throughout. New elements (point D, line AD, congruence marks) are added incrementally.
* **Uncertainty in Alternatives:** The text for the alternative paths (pink boxes) is truncated ("Draw...", "Apply..."), making the exact alternative strategies unclear.
### Interpretation
This diagram visually models the decision-making process or the likelihood of different pathways in constructing a geometric proof. It suggests that for the given initial condition (an isosceles triangle with AB=AC), the most probable or preferred method to prove the base angles are equal is the classic approach involving an angle bisector and triangle congruence.
The high percentages on the primary path imply this is the standard, expected, or most efficient route. The low percentages on the alternative paths indicate they are less common, more difficult, or perhaps dead ends in this specific context. The diagram could be used in an educational setting to illustrate proof strategies, in AI research to model theorem-proving heuristics, or in cognitive science to study problem-solving pathways. The "globe" icons might symbolize the universality of the geometric principles being applied. The final "95%" at the Target State may represent the confidence level or the completion percentage of the overall proof task upon reaching that conclusion.