# Technical Document Extraction: Image Analysis
## Image Description
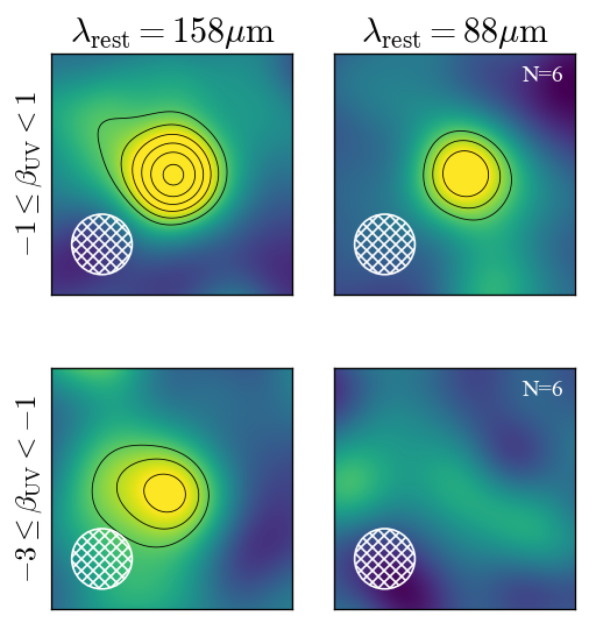
The image consists of a 2x2 grid of heatmaps with contour lines, each panel representing different parameter combinations. Key features include:
- **Color gradients**: Green-to-yellow-to-purple transitions
- **Contour lines**: Yellow concentric circles centered on a white grid pattern
- **Text labels**:
- Top-left: `λ_rest = 158μm`
- Top-right: `λ_rest = 88μm`
- Bottom-left: `-3 ≤ β_UV < -1`
- Bottom-right: `-3 ≤ β_UV < -1` (with `N=6` in top-right corner)
- **Y-axis**: Labeled `-1 ≤ β_UV < 1` (top two panels) and `-3 ≤ β_UV < -1` (bottom two panels)
- **X-axis**: Unlabeled but implied spatial coordinate (grid pattern suggests origin at lower-left)
## Textual Information Extraction
### Labels and Axis Titles
1. **Y-axis**:
- Top panels: `-1 ≤ β_UV < 1`
- Bottom panels: `-3 ≤ β_UV < -1`
2. **X-axis**: No explicit label, but grid pattern implies spatial coordinate system
3. **Panel-specific labels**:
- Top-left: `λ_rest = 158μm`
- Top-right: `λ_rest = 88μm`
- Bottom-right: `N=6` (top-right corner)
### Diagram Components
1. **Contour Lines**:
- Yellow concentric circles centered on white grid pattern
- Density varies: Tighter packing in top-left panel vs. sparser in bottom-left
2. **Color Gradient**:
- Green (low values) → Yellow (mid) → Purple (high)
- Centered on grid pattern in all panels
3. **Grid Pattern**:
- White checkerboard in lower-left corner of each panel
- Likely represents a reference boundary or coordinate origin
## Trend Verification
1. **Top-left panel** (`λ_rest = 158μm`, `-1 ≤ β_UV < 1`):
- Contour lines tightly packed near grid → Steep gradient
- Color gradient peaks at grid center
2. **Bottom-left panel** (`λ_rest = 158μm`, `-3 ≤ β_UV < -1`):
- Contour lines more spread out → Gentler gradient
- Color gradient less intense near grid
3. **Right panels** (`λ_rest = 88μm`):
- Similar contour patterns to left panels
- `N=6` suggests parameter variation (possibly model iterations or data points)
## Spatial Grounding
- **Legend**: No explicit legend present
- **Contour Color**: Yellow (matches all contour lines)
- **Grid Position**:
- Coordinates: `[x_min, y_min]` (lower-left corner)
- Acts as reference point for all contour centers
## Component Isolation
1. **Header**: Panel titles (`λ_rest` values)
2. **Main Chart**:
- Color gradients + contour lines
- Varying density of contours across panels
3. **Footer**:
- Y-axis labels
- `N=6` annotation in bottom-right panel
## Missing Elements
- No explicit data table or numerical values provided
- No legend explaining color gradient meaning
- X-axis label absent (spatial coordinate implied)
## Conclusion
The image presents a comparative analysis of two wavelength regimes (`λ_rest = 158μm` vs. `88μm`) across different β_UV ranges. Contour line density and color gradients suggest varying physical properties or model outputs between panels. The white grid pattern serves as a spatial reference point for all measurements.