## Diagram: Beta Transformation
### Overview
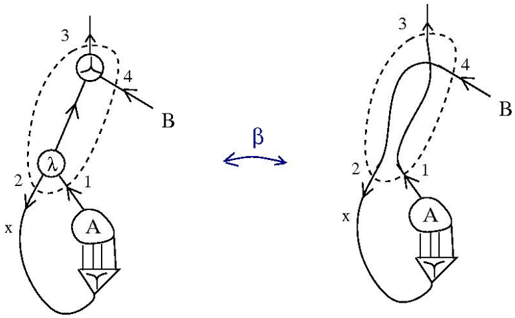
The image presents a diagram illustrating a transformation, labeled "β", between two configurations of a network or graph. Each configuration consists of nodes, edges (represented by lines with arrows indicating direction), and labeled points. The transformation rearranges the connections and spatial arrangement of these elements.
### Components/Axes
* **Nodes:** Represented by circles or rounded shapes, labeled with symbols (λ, A) or graphical elements.
* **Edges:** Represented by lines with arrowheads, indicating the direction of flow or connection.
* **Labels:** Numerical labels (1, 2, 3, 4) and symbolic labels (x, B, A, λ) are used to identify specific points or components.
* **Transformation Arrow:** A blue double-headed arrow labeled "β" indicates the transformation process between the two configurations.
* **Dashed Ellipse:** A dashed ellipse encompasses a portion of the diagram on both sides, highlighting the region undergoing transformation.
### Detailed Analysis
**Left Configuration:**
* A node labeled "A" is located at the bottom-center. It has three vertical lines extending downwards, terminating in a triangular shape.
* A curved line labeled "x" enters the diagram from the bottom-left and connects to a node labeled "λ" at point "2".
* The node "λ" is connected to node "A" via a line labeled "1".
* The node "λ" is connected to another node (containing a three-pronged symbol) via a line.
* The node with the three-pronged symbol has an outgoing line labeled "3" pointing upwards.
* A line labeled "4" exits the node with the three-pronged symbol, pointing to the right and labeled "B".
* A dashed ellipse encompasses the node with the three-pronged symbol, the line connecting it to "λ", and the node "λ".
**Right Configuration:**
* A node labeled "A" is located at the bottom-center, identical to the left configuration.
* A curved line labeled "x" enters the diagram from the bottom-left and connects to a point labeled "2".
* The point labeled "2" is connected to a point labeled "1".
* The point labeled "1" is connected to node "A".
* A line rises upwards, bends to the left, and then curves back to the right, forming a loop. This line is labeled "3" at its top end.
* A line labeled "4" exits the loop, pointing to the right and labeled "B".
* A dashed ellipse encompasses the loop, the points labeled "1" and "2".
### Key Observations
* The transformation "β" rearranges the connections between the nodes and points, altering the spatial arrangement of the network.
* The dashed ellipse highlights the region where the most significant changes occur during the transformation.
* The node "A" and the lines extending from it remain unchanged during the transformation.
* The labels "x" and "B" remain consistent in both configurations, indicating they are external inputs/outputs.
### Interpretation
The diagram illustrates a specific type of network transformation, denoted by "β". This transformation involves rearranging the connections and spatial arrangement of nodes and edges within a defined region (indicated by the dashed ellipse). The transformation maintains certain elements (node "A", labels "x" and "B") while altering the connectivity of other elements (the loop and the nodes within the ellipse). This type of transformation could represent a simplification, optimization, or restructuring of the network for a specific purpose. The diagram provides a visual representation of the before-and-after states of the network, highlighting the changes induced by the "β" transformation.