\n
## Diagram: Molecular Orbital Energy Level Diagram
### Overview
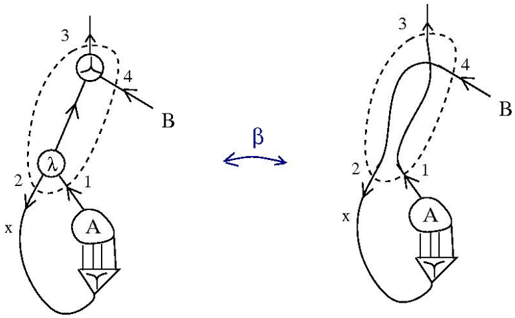
The image depicts a molecular orbital energy level diagram for a diatomic molecule, showing the interaction of atomic orbitals to form bonding and antibonding molecular orbitals. Two diagrams are presented side-by-side, connected by a double-headed arrow labeled "β", indicating a potential transformation or relationship between the two configurations. The diagrams illustrate the filling of molecular orbitals with electrons.
### Components/Axes
The diagram consists of the following components:
* **Atomic Orbitals:** Represented by circles labeled 'A' and 'λ' (lambda). 'A' has vertical lines extending downwards, suggesting s-character. 'λ' is a more complex orbital shape.
* **Molecular Orbitals:** Represented by energy levels indicated by numbers 1 through 4, and a higher energy level at the top (labeled 3).
* **Electrons:** Represented by arrows within the orbitals, indicating spin.
* **Diatomic Molecule:** The overall structure represents a diatomic molecule with atoms labeled 'A' and 'B'.
* **Arrows:** Indicate the energy levels and orbital interactions.
* **Dashed Lines:** Show the mixing of atomic orbitals to form molecular orbitals.
* **Label 'x':** Indicates the initial state of the atomic orbitals.
* **Label 'β':** Indicates a transformation or relationship between the two diagrams.
### Detailed Analysis or Content Details
**Left Diagram:**
* **Atom A:** Contains two electrons in the orbital with vertical lines (s-orbital).
* **Atom λ:** Contains two electrons in the orbital labeled 'λ'.
* **Molecular Orbital 1:** Filled with two electrons (opposite spins).
* **Molecular Orbital 2:** Filled with two electrons (opposite spins).
* **Molecular Orbital 3:** Empty.
* **Molecular Orbital 4:** Contains two electrons (opposite spins).
* **Energy Level 3:** Shows a higher energy level with a circular representation, indicating a non-bonding or antibonding orbital.
* **Arrow B:** Points to the higher energy level.
**Right Diagram:**
* **Atom A:** Contains two electrons in the orbital with vertical lines (s-orbital).
* **Atom λ:** Contains two electrons in the orbital labeled 'λ'.
* **Molecular Orbital 1:** Filled with two electrons (opposite spins).
* **Molecular Orbital 2:** Empty.
* **Molecular Orbital 3:** Filled with two electrons (opposite spins).
* **Molecular Orbital 4:** Contains two electrons (opposite spins).
* **Energy Level 3:** Shows a higher energy level with a circular representation, indicating a non-bonding or antibonding orbital.
* **Arrow B:** Points to the higher energy level.
### Key Observations
* The diagrams show a change in the electron distribution within the molecular orbitals. In the left diagram, orbitals 1, 2, and 4 are filled, while in the right diagram, orbitals 1, 3, and 4 are filled.
* The transformation indicated by "β" suggests a shift of electrons from orbital 2 to orbital 3.
* The diagrams represent different electronic configurations of the diatomic molecule.
* The 'λ' orbital appears to be involved in the formation of the molecular orbitals.
### Interpretation
The diagram illustrates the concept of molecular orbital formation and electron configuration in a diatomic molecule. The "β" transformation likely represents an excitation or rearrangement of electrons within the molecular orbitals, potentially due to an external stimulus like light or heat. The change in electron distribution affects the molecule's energy and properties. The diagram suggests that the molecule can exist in different electronic states, each with its own energy level and stability. The filling of the molecular orbitals follows Hund's rule and the Pauli exclusion principle. The diagram is a simplified representation of a complex quantum mechanical phenomenon, but it effectively conveys the basic principles of molecular orbital theory. The difference in the diagrams suggests a change in the molecule's electronic state, potentially related to a transition between bonding and antibonding orbitals.