## Diagram: Bayesian Network Structures
### Overview
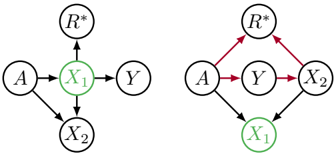
The image presents two Bayesian network diagrams illustrating relationships between variables. The diagrams use nodes (circles) to represent variables and directed edges (arrows) to represent dependencies. The left diagram shows a structure where variable X1 influences other variables, while the right diagram shows a different structure with feedback loops and a different variable influencing X1.
### Components/Axes
**Left Diagram:**
* **Nodes:**
* A: Variable A, represented by a circle.
* R*: Variable R*, represented by a circle.
* X1: Variable X1, represented by a green circle.
* Y: Variable Y, represented by a circle.
* X2: Variable X2, represented by a circle.
* **Edges:**
* A -> X1: A influences X1.
* R* -> X1: R* influences X1.
* X1 -> Y: X1 influences Y.
* X1 -> X2: X1 influences X2.
* A -> X2: A influences X2.
**Right Diagram:**
* **Nodes:**
* A: Variable A, represented by a circle.
* R*: Variable R*, represented by a circle.
* X1: Variable X1, represented by a green circle.
* Y: Variable Y, represented by a circle.
* X2: Variable X2, represented by a circle.
* **Edges:**
* A -> X1: A influences X1.
* X2 -> X1: X2 influences X1.
* A -> Y: A influences Y (red arrow).
* Y -> X2: Y influences X2 (red arrow).
* A -> R*: A influences R* (red arrow).
* R* -> X2: R* influences X2 (red arrow).
### Detailed Analysis or ### Content Details
**Left Diagram:**
* Variable X1 is influenced by both A and R*.
* Variable X1 directly influences Y and X2.
* Variable A also directly influences X2.
**Right Diagram:**
* Variable X1 is influenced by both A and X2.
* There is a feedback loop between A, Y, and X2.
* Variable R* is influenced by A and influences X2.
### Key Observations
* The two diagrams represent different causal structures involving the same set of variables.
* The left diagram has a simpler, feed-forward structure, while the right diagram has feedback loops.
* The variable X1 is green in both diagrams, which might indicate a special role or characteristic.
* The right diagram has red arrows, indicating a different type of relationship or influence compared to the black arrows.
### Interpretation
The diagrams illustrate how different Bayesian network structures can represent different causal relationships between variables. The left diagram suggests a scenario where X1 is a central variable influencing other variables, while the right diagram suggests a more complex scenario with feedback loops and a different variable influencing X1. The red arrows in the right diagram might represent a different type of causal relationship, such as a regulatory or inhibitory effect. The green color of X1 might indicate that it is an observed variable, a target variable, or a variable of particular interest.