## Diagram: Network Structure Comparison
### Overview
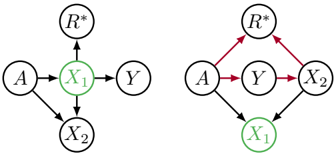
The image contains two side-by-side diagrams comparing network structures. Both diagrams feature nodes labeled **A**, **X₁**, **X₂**, **Y**, and **R***, with directional arrows indicating relationships or flows. The left diagram emphasizes **X₁** as a central hub, while the right diagram introduces additional interconnections and red arrows highlighting specific pathways.
### Components/Axes
- **Nodes**:
- **A**: Connected to **X₁** (left) and **Y** (right).
- **X₁**: Central node (green circle) in both diagrams; connected to **A**, **Y**, **X₂**, and **R*** (left); also connected to **Y** and **R*** (right).
- **X₂**: Connected to **X₁** (left) and **Y** (right).
- **Y**: Connected to **X₁** (left) and **X₂** (right).
- **R***: Connected to **X₁** (left) and forms a loop with **A**, **Y**, and **X₂** (right).
- **Arrows**:
- **Left Diagram**: Black arrows indicate unidirectional flows (e.g., **A → X₁**, **X₁ → Y**).
- **Right Diagram**: Red arrows highlight a cyclic pathway (**A → Y → X₂ → R* → X₁ → Y**).
### Detailed Analysis
- **Left Diagram**:
- **X₁** acts as a central mediator, with all nodes (**A**, **Y**, **X₂**, **R***) directly connected to it.
- No cyclic pathways; flows terminate at **X₁** or proceed to **Y**/**X₂**.
- **Right Diagram**:
- Introduces a closed loop (**A → Y → X₂ → R* → X₁ → Y**), suggesting feedback or dependency cycles.
- **X₁** remains central but now interacts with **R*** and **X₂** in a bidirectional manner.
### Key Observations
1. **X₁** is consistently highlighted (green circle) as a critical node in both structures.
2. The right diagram’s red arrows emphasize a **cyclic dependency** involving **A**, **Y**, **X₂**, and **R***, absent in the left diagram.
3. **R***’s role shifts from a peripheral node (left) to a participant in a feedback loop (right).
### Interpretation
The diagrams likely represent two scenarios of network behavior:
- **Left Diagram**: A hierarchical or star-topology system where **X₁** centralizes control or data flow.
- **Right Diagram**: A decentralized or cyclic system where **X₁** integrates into a feedback loop, potentially enabling dynamic interactions (e.g., reinforcement, oscillations).
The red arrows in the right diagram may symbolize prioritized or error-prone pathways, while the green **X₁** node underscores its stability or importance across both models. This contrast could illustrate trade-offs between centralized efficiency (left) and distributed resilience (right).