## Chart: EM and F1 Scores on Various Datasets
### Overview
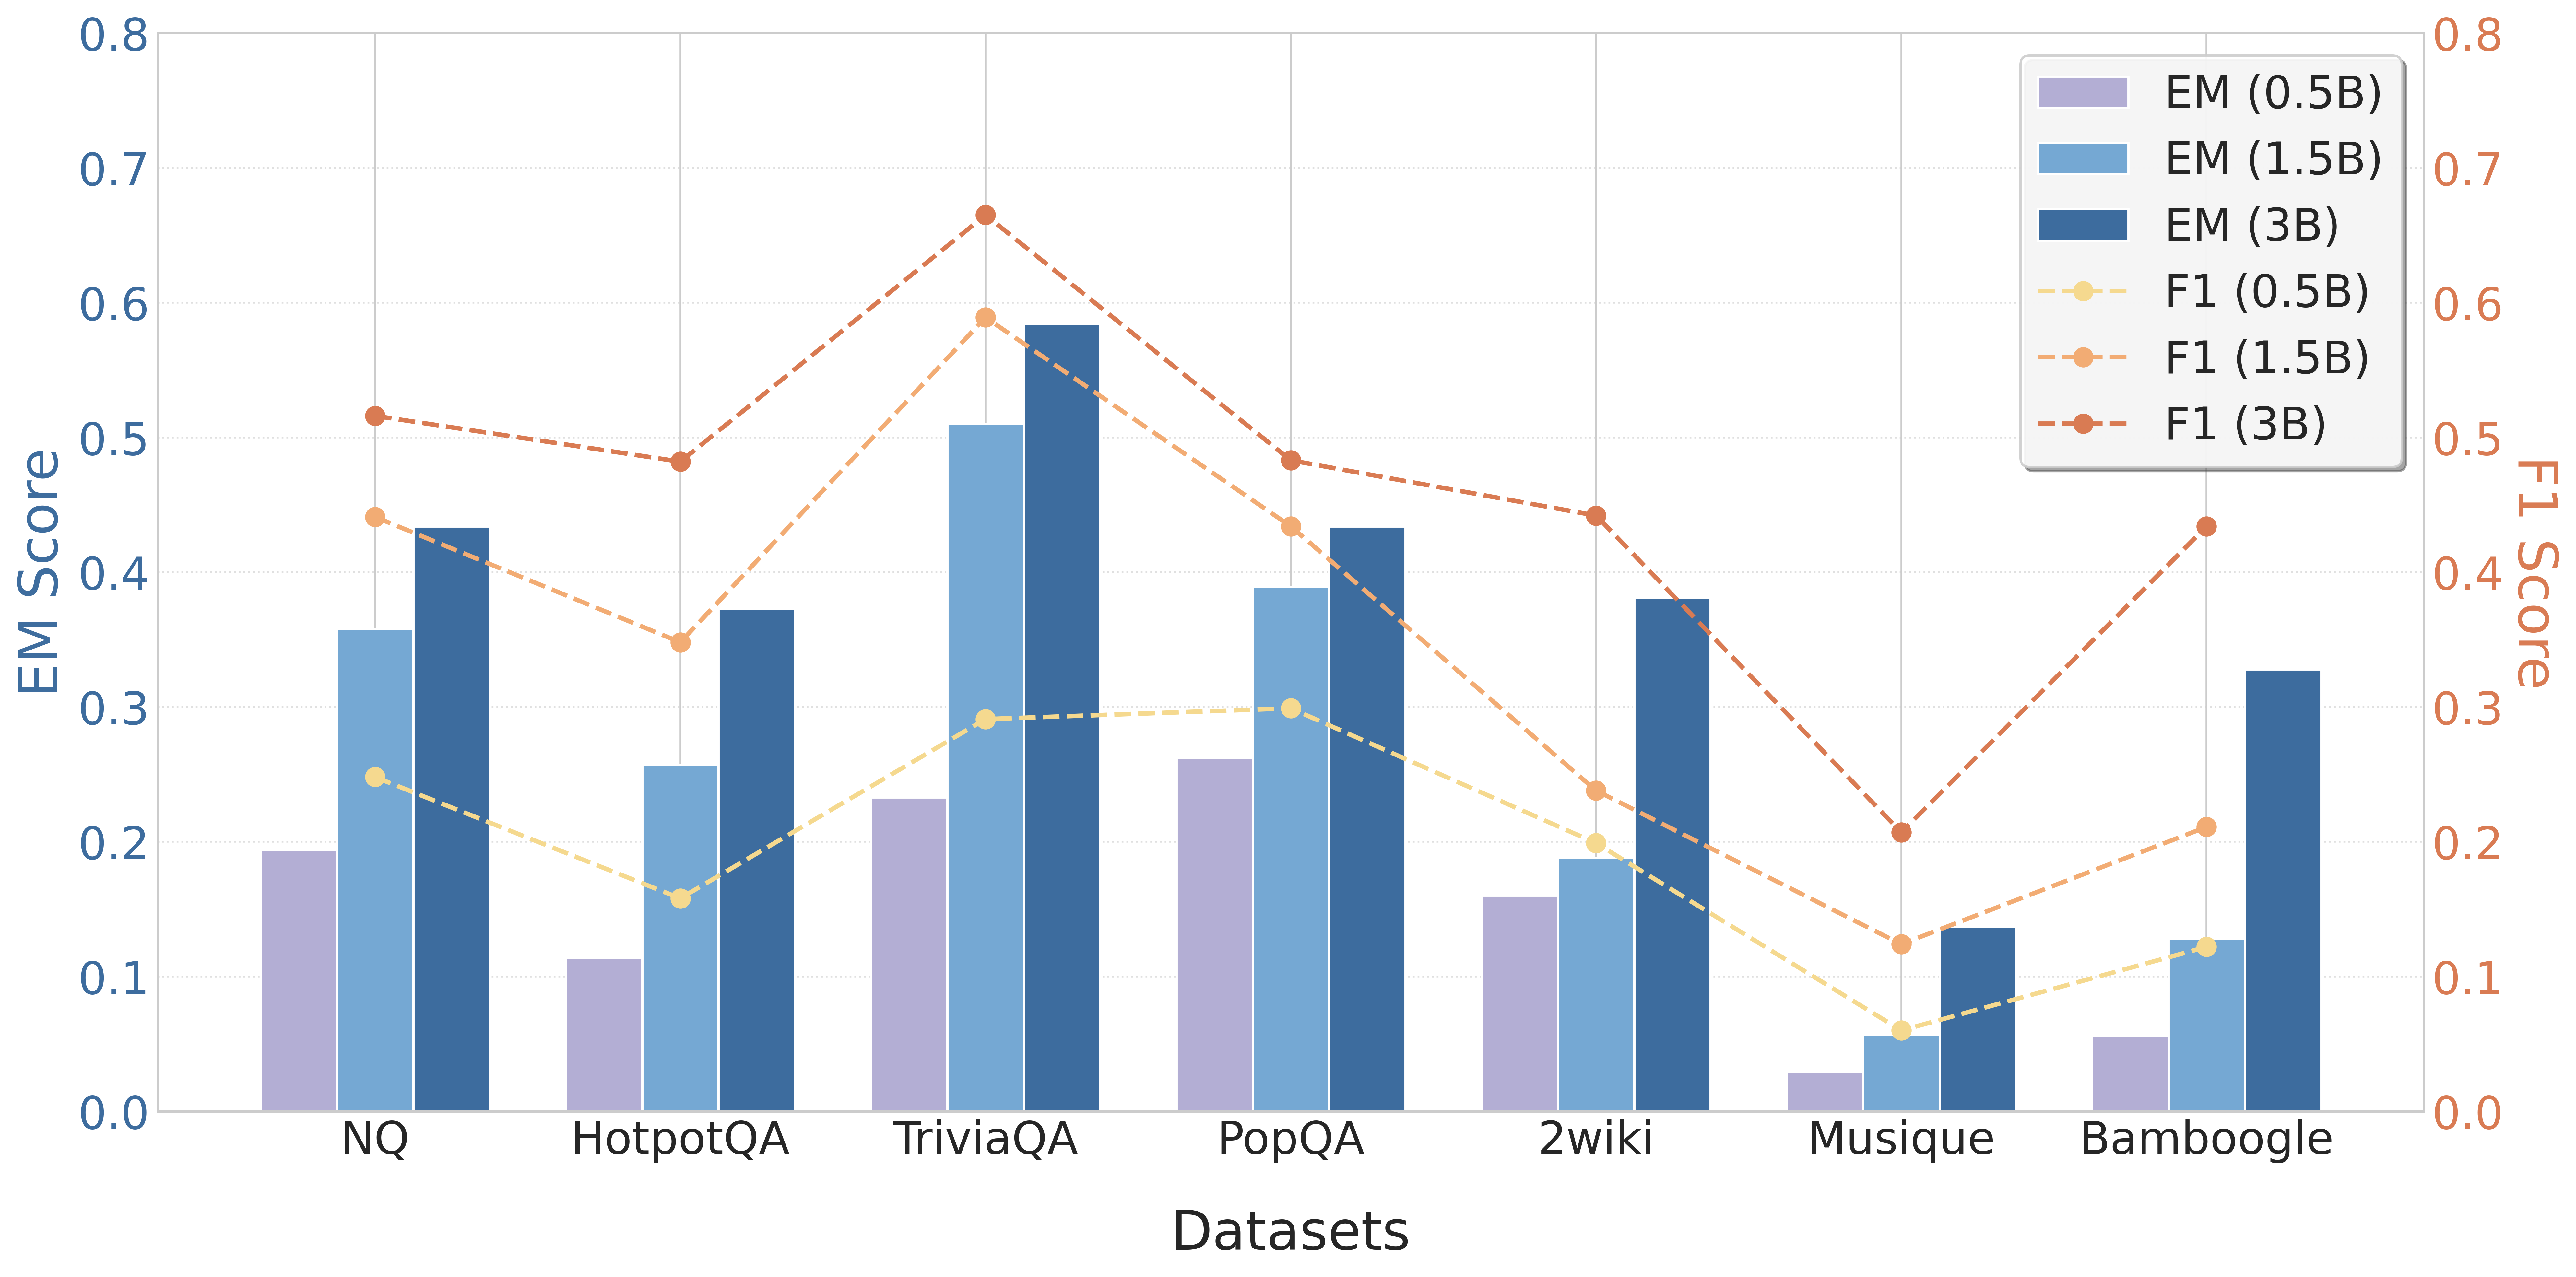
The image is a bar and line chart comparing the EM (Exact Match) and F1 scores of a model on various datasets. The x-axis represents the datasets, and the y-axes represent the EM score (left) and F1 score (right). The chart displays the performance of the model with different parameter sizes (0.5B, 1.5B, and 3B).
### Components/Axes
* **X-axis:** Datasets (NQ, HotpotQA, TriviaQA, PopQA, 2wiki, Musique, Bamboogle)
* **Left Y-axis:** EM Score, ranging from 0.0 to 0.8 in increments of 0.1.
* **Right Y-axis:** F1 Score, ranging from 0.0 to 0.8 in increments of 0.1.
* **Legend (top-right):**
* EM (0.5B) - Light Purple Bar
* EM (1.5B) - Light Blue Bar
* EM (3B) - Dark Blue Bar
* F1 (0.5B) - Light Yellow Dashed Line with Circle Markers
* F1 (1.5B) - Light Orange Dashed Line with Circle Markers
* F1 (3B) - Dark Orange Dashed Line with Circle Markers
### Detailed Analysis
**EM Scores (Bar Charts):**
* **NQ:**
* EM (0.5B): ~0.2
* EM (1.5B): ~0.36
* EM (3B): ~0.44
* **HotpotQA:**
* EM (0.5B): ~0.11
* EM (1.5B): ~0.26
* EM (3B): ~0.38
* **TriviaQA:**
* EM (0.5B): ~0.23
* EM (1.5B): ~0.52
* EM (3B): ~0.59
* **PopQA:**
* EM (0.5B): ~0.26
* EM (1.5B): ~0.4
* EM (3B): ~0.44
* **2wiki:**
* EM (0.5B): ~0.16
* EM (1.5B): ~0.21
* EM (3B): ~0.39
* **Musique:**
* EM (0.5B): ~0.03
* EM (1.5B): ~0.07
* EM (3B): ~0.14
* **Bamboogle:**
* EM (0.5B): ~0.06
* EM (1.5B): ~0.13
* EM (3B): ~0.34
**F1 Scores (Line Charts):**
* **F1 (0.5B) - Light Yellow Dashed Line:**
* NQ: ~0.25
* HotpotQA: ~0.17
* TriviaQA: ~0.3
* PopQA: ~0.3
* 2wiki: ~0.21
* Musique: ~0.06
* Bamboogle: ~0.23
* **F1 (1.5B) - Light Orange Dashed Line:**
* NQ: ~0.52
* HotpotQA: ~0.48
* TriviaQA: ~0.67
* PopQA: ~0.44
* 2wiki: ~0.45
* Musique: ~0.21
* Bamboogle: ~0.44
* **F1 (3B) - Dark Orange Dashed Line:**
* NQ: ~0.44
* HotpotQA: ~0.37
* TriviaQA: ~0.58
* PopQA: ~0.39
* 2wiki: ~0.26
* Musique: ~0.12
* Bamboogle: ~0.13
### Key Observations
* For both EM and F1 scores, performance generally increases with the parameter size (0.5B < 1.5B < 3B).
* TriviaQA consistently shows high EM and F1 scores across all parameter sizes.
* Musique and Bamboogle datasets have relatively low EM scores compared to other datasets.
* The F1 score for 1.5B parameters is generally higher than the F1 score for 3B parameters.
### Interpretation
The chart illustrates the impact of model size on the performance of question-answering models across different datasets. The increase in EM and F1 scores with larger parameter sizes (0.5B to 3B) suggests that larger models are better at understanding and answering questions. However, the F1 score for 1.5B parameters being higher than the F1 score for 3B parameters suggests that there may be a point of diminishing returns or overfitting with larger models, especially for the F1 score. The varying performance across datasets indicates that some datasets are inherently more challenging for the model. TriviaQA appears to be a relatively easier dataset, while Musique and Bamboogle are more difficult.