\n
## Bar and Line Chart: Performance Comparison of Models on Question Answering Datasets
### Overview
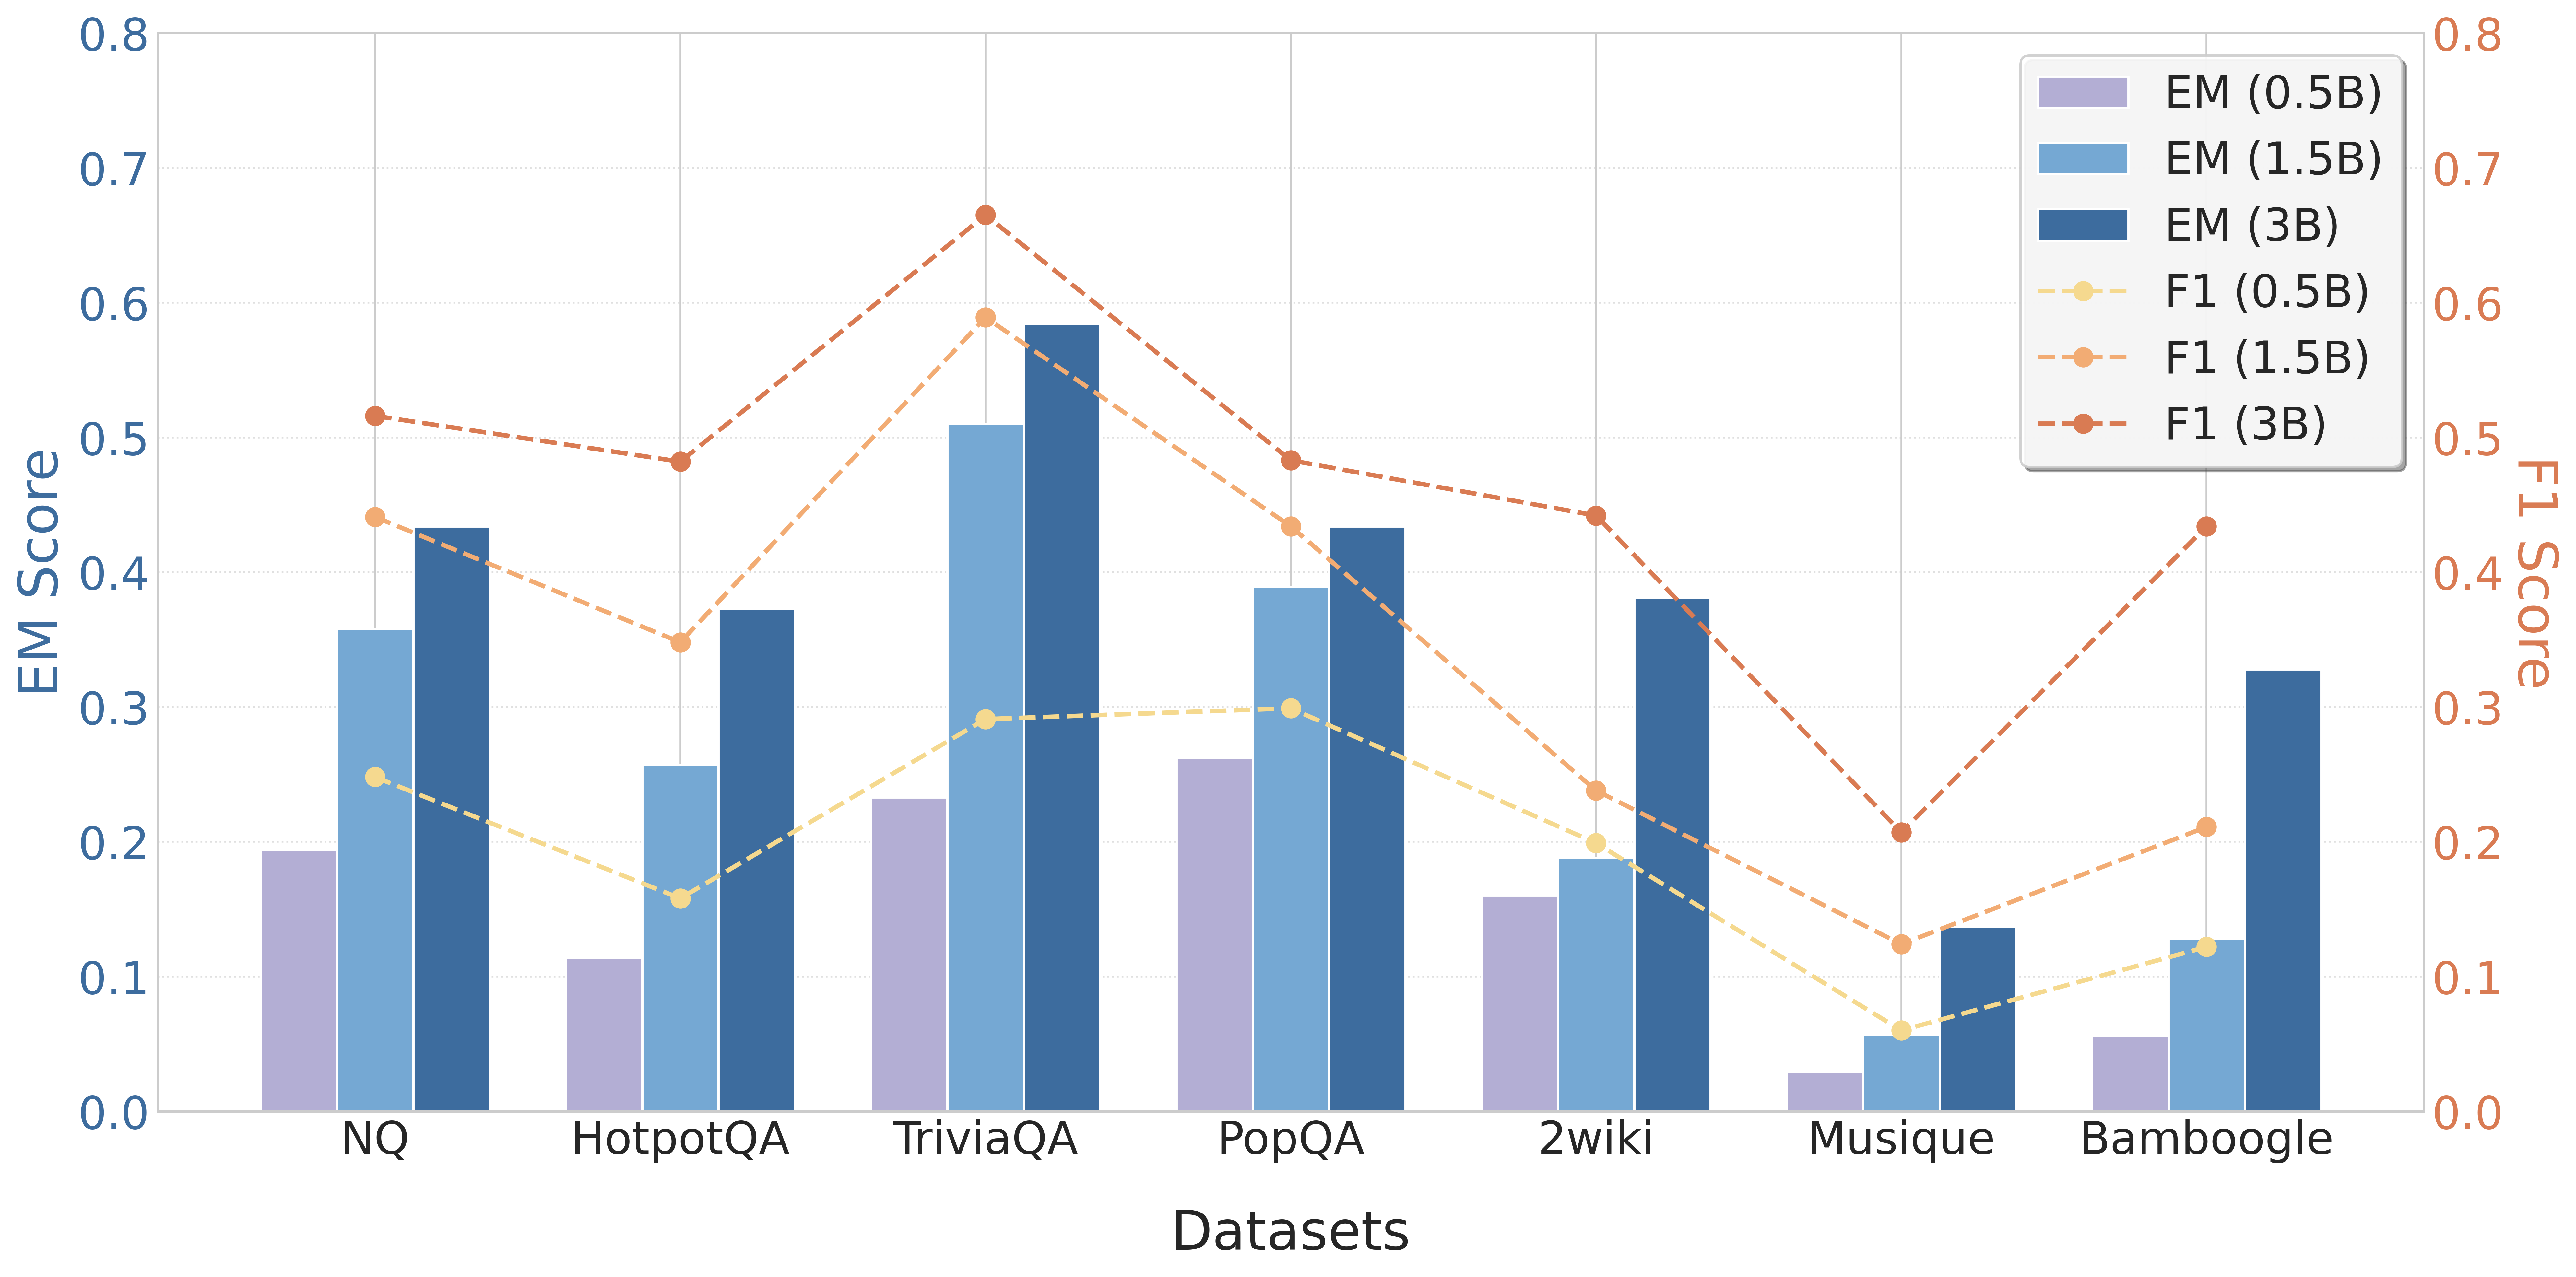
This chart compares the performance of three model sizes (0.5B, 1.5B, and 3B parameters) on seven different question answering datasets. The performance is measured using two metrics: Exact Match (EM) score, represented by bars, and F1 score, represented by lines. The chart visually presents how the model performance varies across datasets and model sizes.
### Components/Axes
* **X-axis:** Datasets - NQ, HotpotQA, TriviaQA, PopQA, 2wiki, Musique, and Bamboggle.
* **Left Y-axis:** EM Score (ranging from 0.0 to 0.8).
* **Right Y-axis:** F1 Score (ranging from 0.0 to 0.8).
* **Legend (top-right):**
* EM (0.5B) - Light Blue
* EM (1.5B) - Medium Blue
* EM (3B) - Dark Blue
* F1 (0.5B) - Orange, dashed line
* F1 (1.5B) - Salmon, dashed line
* F1 (3B) - Brown, dashed line
### Detailed Analysis
Let's analyze the data series and values, dataset by dataset.
**NQ:**
* EM (0.5B): Approximately 0.18
* EM (1.5B): Approximately 0.44
* EM (3B): Approximately 0.48
* F1 (0.5B): Starts at approximately 0.52, decreasing to approximately 0.48
* F1 (1.5B): Starts at approximately 0.52, decreasing to approximately 0.46
* F1 (3B): Starts at approximately 0.52, decreasing to approximately 0.48
**HotpotQA:**
* EM (0.5B): Approximately 0.12
* EM (1.5B): Approximately 0.34
* EM (3B): Approximately 0.38
* F1 (0.5B): Starts at approximately 0.48, decreasing to approximately 0.42
* F1 (1.5B): Starts at approximately 0.48, decreasing to approximately 0.44
* F1 (3B): Starts at approximately 0.48, decreasing to approximately 0.46
**TriviaQA:**
* EM (0.5B): Approximately 0.25
* EM (1.5B): Approximately 0.52
* EM (3B): Approximately 0.58
* F1 (0.5B): Starts at approximately 0.68, decreasing to approximately 0.62
* F1 (1.5B): Starts at approximately 0.68, decreasing to approximately 0.64
* F1 (3B): Starts at approximately 0.70, decreasing to approximately 0.66
**PopQA:**
* EM (0.5B): Approximately 0.18
* EM (1.5B): Approximately 0.46
* EM (3B): Approximately 0.49
* F1 (0.5B): Starts at approximately 0.42, decreasing to approximately 0.38
* F1 (1.5B): Starts at approximately 0.42, decreasing to approximately 0.38
* F1 (3B): Starts at approximately 0.44, decreasing to approximately 0.40
**2wiki:**
* EM (0.5B): Approximately 0.12
* EM (1.5B): Approximately 0.22
* EM (3B): Approximately 0.24
* F1 (0.5B): Starts at approximately 0.38, decreasing to approximately 0.34
* F1 (1.5B): Starts at approximately 0.38, decreasing to approximately 0.34
* F1 (3B): Starts at approximately 0.40, decreasing to approximately 0.36
**Musique:**
* EM (0.5B): Approximately 0.08
* EM (1.5B): Approximately 0.32
* EM (3B): Approximately 0.36
* F1 (0.5B): Starts at approximately 0.36, decreasing to approximately 0.32
* F1 (1.5B): Starts at approximately 0.36, decreasing to approximately 0.32
* F1 (3B): Starts at approximately 0.38, decreasing to approximately 0.34
**Bamboggle:**
* EM (0.5B): Approximately 0.10
* EM (1.5B): Approximately 0.32
* EM (3B): Approximately 0.46
* F1 (0.5B): Starts at approximately 0.40, increasing to approximately 0.48
* F1 (1.5B): Starts at approximately 0.40, increasing to approximately 0.44
* F1 (3B): Starts at approximately 0.42, increasing to approximately 0.48
### Key Observations
* Generally, increasing the model size (from 0.5B to 3B) improves both EM and F1 scores across all datasets.
* The F1 scores tend to decrease across most datasets as the model processes more information, suggesting a potential issue with maintaining consistency or relevance over longer contexts.
* Bamboggle is the only dataset where the F1 score *increases* with processing, indicating a different behavior compared to other datasets.
* TriviaQA shows the highest EM scores for all model sizes, suggesting it is the easiest dataset for these models.
* 2wiki and Musique consistently have the lowest EM scores, indicating they are the most challenging datasets.
### Interpretation
The chart demonstrates a clear positive correlation between model size and performance on question answering tasks, as measured by EM and F1 scores. Larger models (3B) consistently outperform smaller models (0.5B and 1.5B). However, the decreasing F1 scores across most datasets suggest that these models struggle with maintaining performance as the input context grows. This could be due to limitations in attention mechanisms or the accumulation of errors during processing.
The unique behavior of Bamboggle, where F1 scores *increase* with processing, is an anomaly that warrants further investigation. It could indicate that the dataset has a specific structure or characteristics that benefit from longer context processing.
The varying performance across datasets highlights the importance of dataset characteristics in evaluating model capabilities. Some datasets (like TriviaQA) are inherently easier for these models, while others (like 2wiki and Musique) pose significant challenges. This suggests that models may need to be specifically tuned or adapted for different types of question answering tasks.