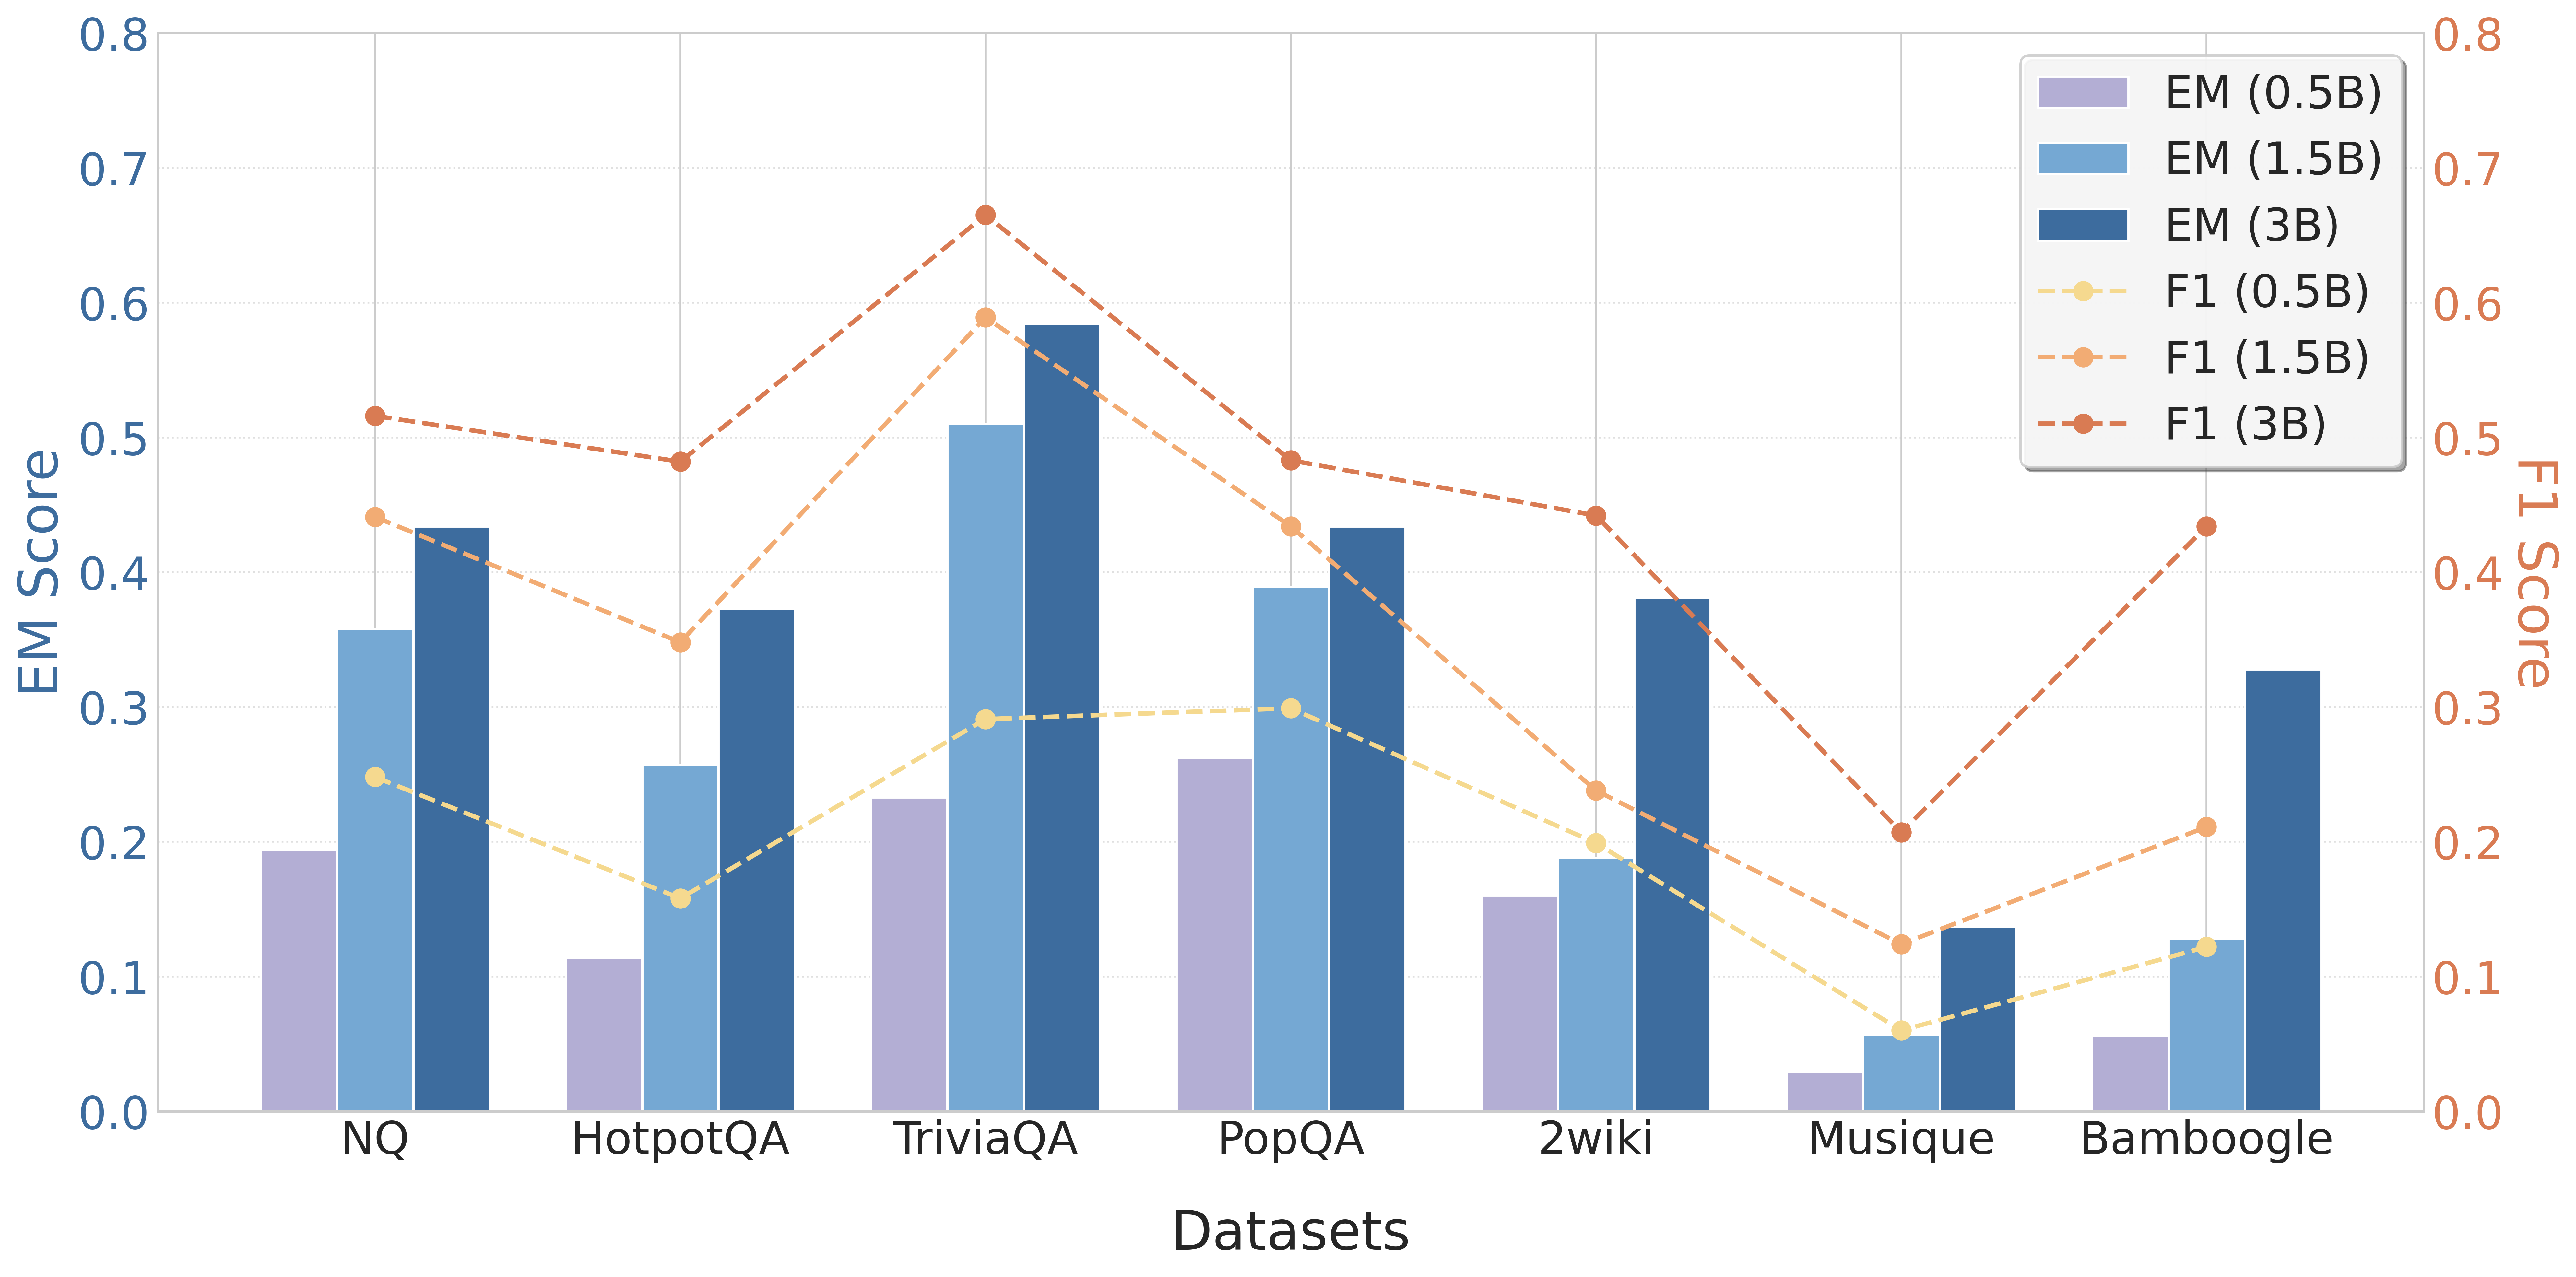
## Bar Chart: Model Performance Comparison Across Datasets
### Overview
The chart compares Entity Matching (EM) and F1 scores for three model sizes (0.5B, 1.5B, 3B parameters) across seven datasets (NQ, HotpotQA, TriviaQA, PopQA, 2wiki, Musique, Bamboogle). EM scores are represented by bars, while F1 scores are shown as dashed lines. The legend uses color coding to distinguish model sizes and metrics.
### Components/Axes
- **X-axis**: Datasets (NQ, HotpotQA, TriviaQA, PopQA, 2wiki, Musique, Bamboogle)
- **Y-axis (left)**: EM Score (0.0–0.8)
- **Y-axis (right)**: F1 Score (0.0–0.8)
- **Legend**:
- EM (0.5B): Purple bars
- EM (1.5B): Blue bars
- EM (3B): Dark blue bars
- F1 (0.5B): Yellow dashed line
- F1 (1.5B): Orange dashed line
- F1 (3B): Red dashed line
### Detailed Analysis
#### EM Scores (Bars)
1. **NQ**:
- 0.5B: ~0.2
- 1.5B: ~0.35
- 3B: ~0.43
2. **HotpotQA**:
- 0.5B: ~0.12
- 1.5B: ~0.25
- 3B: ~0.37
3. **TriviaQA**:
- 0.5B: ~0.23
- 1.5B: ~0.51
- 3B: ~0.59
4. **PopQA**:
- 0.5B: ~0.26
- 1.5B: ~0.39
- 3B: ~0.43
5. **2wiki**:
- 0.5B: ~0.16
- 1.5B: ~0.19
- 3B: ~0.38
6. **Musique**:
- 0.5B: ~0.03
- 1.5B: ~0.06
- 3B: ~0.14
7. **Bamboogle**:
- 0.5B: ~0.06
- 1.5B: ~0.12
- 3B: ~0.33
#### F1 Scores (Dashed Lines)
1. **NQ**:
- 0.5B: ~0.25
- 1.5B: ~0.44
- 3B: ~0.52
2. **HotpotQA**:
- 0.5B: ~0.16
- 1.5B: ~0.35
- 3B: ~0.48
3. **TriviaQA**:
- 0.5B: ~0.29
- 1.5B: ~0.59
- 3B: ~0.66
4. **PopQA**:
- 0.5B: ~0.30
- 1.5B: ~0.43
- 3B: ~0.48
5. **2wiki**:
- 0.5B: ~0.22
- 1.5B: ~0.25
- 3B: ~0.44
6. **Musique**:
- 0.5B: ~0.06
- 1.5B: ~0.12
- 3B: ~0.21
7. **Bamboogle**:
- 0.5B: ~0.11
- 1.5B: ~0.21
- 3B: ~0.43
### Key Observations
1. **EM Score Trends**:
- Larger models (3B) consistently outperform smaller models across all datasets.
- **Exceptions**: Bamboogle shows a significant drop in EM score for 3B (~0.33) compared to 1.5B (~0.12), suggesting dataset-specific challenges.
- Musique performs poorly across all model sizes, with EM scores below 0.15.
2. **F1 Score Trends**:
- F1 scores generally increase with model size, mirroring EM trends.
- **Notable**: TriviaQA and Bamboogle show the largest F1 improvements with larger models.
- F1 scores are consistently higher than EM scores for equivalent model sizes, indicating better overall performance metrics.
3. **Dataset Variability**:
- TriviaQA and Bamboogle exhibit the highest performance gains with larger models.
- Musique remains the weakest dataset, with scores below 0.25 for all metrics.
### Interpretation
The data demonstrates a clear correlation between model size and performance, with 3B models achieving the highest scores in most cases. However, Bamboogle's anomalous EM score suggests dataset-specific limitations in larger models. F1 scores consistently outperform EM scores, highlighting their effectiveness in evaluating model performance. The Musique dataset's poor performance across all metrics indicates potential challenges in its composition or evaluation criteria. These trends underscore the importance of model scaling for complex tasks but also emphasize the need for dataset-specific optimization.