## Line Chart: RMSE vs. n for Different Algorithms
### Overview
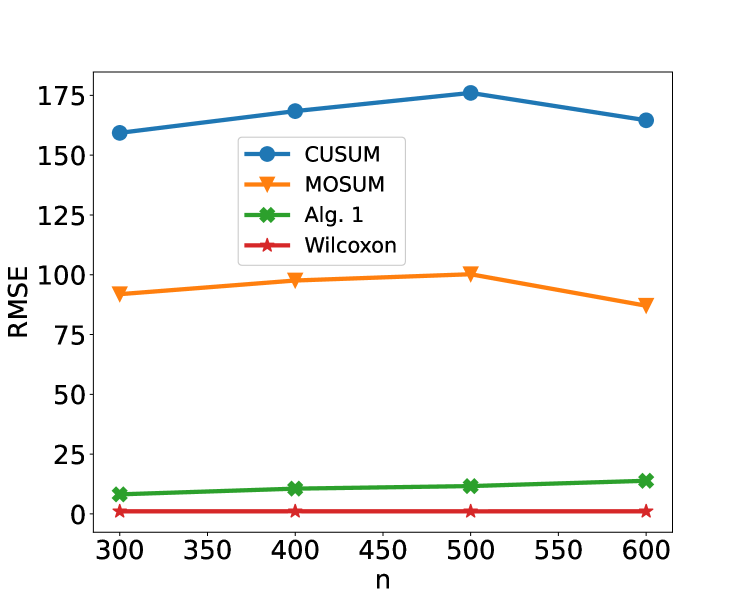
The image is a line chart comparing the Root Mean Squared Error (RMSE) of four different algorithms (CUSUM, MOSUM, Alg. 1, and Wilcoxon) as a function of 'n'. The x-axis represents 'n', and the y-axis represents RMSE.
### Components/Axes
* **X-axis:** 'n', with values ranging from 300 to 600 in increments of 100.
* **Y-axis:** 'RMSE', with values ranging from 0 to 175 in increments of 25.
* **Legend:** Located in the top-right quadrant of the chart, it identifies the algorithms and their corresponding line colors:
* CUSUM (blue line with circle markers)
* MOSUM (orange line with triangle markers)
* Alg. 1 (green line with 'x' markers)
* Wilcoxon (red line with star markers)
### Detailed Analysis
* **CUSUM (blue):** The line starts at approximately RMSE = 160 when n = 300. It increases to about RMSE = 170 at n = 400, then to approximately RMSE = 175 at n = 500, and decreases to about RMSE = 165 at n = 600.
* **MOSUM (orange):** The line starts at approximately RMSE = 93 when n = 300. It increases to about RMSE = 98 at n = 400, then to approximately RMSE = 101 at n = 500, and decreases to about RMSE = 88 at n = 600.
* **Alg. 1 (green):** The line starts at approximately RMSE = 8 when n = 300. It increases to about RMSE = 10 at n = 400, then to approximately RMSE = 11 at n = 500, and increases to about RMSE = 14 at n = 600.
* **Wilcoxon (red):** The line remains relatively constant at approximately RMSE = 1 for all values of 'n'.
### Key Observations
* CUSUM has the highest RMSE values across the range of 'n' values.
* Wilcoxon has the lowest RMSE values and remains relatively stable.
* Alg. 1 has low RMSE values, but they increase slightly with 'n'.
* MOSUM has intermediate RMSE values.
### Interpretation
The chart compares the performance of four algorithms based on their RMSE as 'n' varies. CUSUM exhibits the highest error, while Wilcoxon demonstrates the lowest and most stable error. Alg. 1 shows a slight increase in error as 'n' increases. MOSUM's error is in between CUSUM and Alg. 1, and it also varies with 'n'. The data suggests that for the given scenario, the Wilcoxon algorithm is the most accurate, while CUSUM is the least accurate. The choice of algorithm would depend on the specific requirements of the application, considering the trade-offs between accuracy and computational complexity.