## Line Chart: RMSE vs. n for Different Algorithms
### Overview
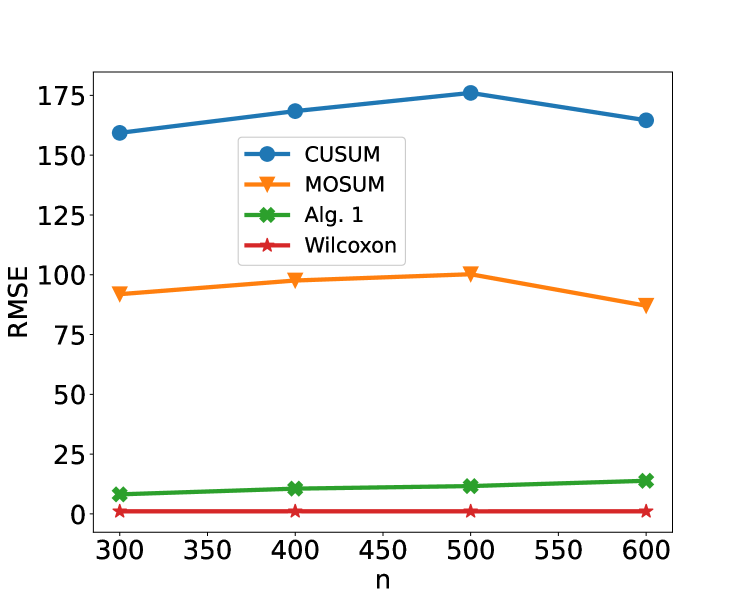
This image displays a line chart that plots the Root Mean Square Error (RMSE) against a variable 'n' for four different algorithms: CUSUM, MOSUM, Alg. 1, and Wilcoxon. The chart shows how the RMSE changes for each algorithm as 'n' increases.
### Components/Axes
* **Y-axis Label**: RMSE
* **Scale**: Linear, ranging from 0 to 175, with major ticks at 0, 25, 50, 75, 100, 125, 150, and 175.
* **X-axis Label**: n
* **Scale**: Linear, ranging from approximately 300 to 600, with major ticks at 300, 350, 400, 450, 500, 550, and 600.
* **Legend**: Located in the top-center of the chart, it identifies the four data series with corresponding markers and colors:
* **CUSUM**: Blue line with circular markers (●).
* **MOSUM**: Orange line with triangular markers (▼).
* **Alg. 1**: Green line with 'x' markers (x).
* **Wilcoxon**: Red line with star markers (★).
### Detailed Analysis or Content Details
**Data Series Trends and Points:**
1. **CUSUM (Blue line with ● markers):**
* **Trend**: The CUSUM line generally slopes upward from n=300 to n=500, and then slightly slopes downward from n=500 to n=600.
* **Data Points (approximate):**
* At n = 300: RMSE ≈ 158
* At n = 400: RMSE ≈ 170
* At n = 500: RMSE ≈ 175
* At n = 600: RMSE ≈ 168
2. **MOSUM (Orange line with ▼ markers):**
* **Trend**: The MOSUM line shows a consistent upward trend from n=300 to n=500, and then a downward trend from n=500 to n=600.
* **Data Points (approximate):**
* At n = 300: RMSE ≈ 95
* At n = 400: RMSE ≈ 99
* At n = 500: RMSE ≈ 101
* At n = 600: RMSE ≈ 90
3. **Alg. 1 (Green line with x markers):**
* **Trend**: The Alg. 1 line shows a very slight upward trend across the observed range of 'n'.
* **Data Points (approximate):**
* At n = 300: RMSE ≈ 8
* At n = 400: RMSE ≈ 10
* At n = 500: RMSE ≈ 11
* At n = 600: RMSE ≈ 13
4. **Wilcoxon (Red line with ★ markers):**
* **Trend**: The Wilcoxon line remains relatively flat and consistently low across the observed range of 'n'.
* **Data Points (approximate):**
* At n = 300: RMSE ≈ 2
* At n = 400: RMSE ≈ 2
* At n = 500: RMSE ≈ 2
* At n = 600: RMSE ≈ 2
### Key Observations
* **Performance Hierarchy**: The Wilcoxon algorithm consistently exhibits the lowest RMSE across all values of 'n', indicating the best performance in terms of accuracy. Alg. 1 shows the next lowest RMSE, followed by MOSUM, and then CUSUM, which has the highest RMSE.
* **CUSUM and MOSUM Behavior**: Both CUSUM and MOSUM show a peak in RMSE around n=500, after which their RMSE decreases. This suggests a potential non-monotonic relationship between 'n' and RMSE for these algorithms, or that the optimal 'n' for these methods might be around 500 in this context.
* **Alg. 1 Stability**: Alg. 1 demonstrates a stable and gradually increasing RMSE, suggesting consistent performance with a slight degradation as 'n' increases.
* **Wilcoxon Stability**: The Wilcoxon algorithm shows remarkable stability with a very low and nearly constant RMSE, indicating robust performance irrespective of 'n'.
### Interpretation
This chart demonstrates the comparative performance of four different algorithms (CUSUM, MOSUM, Alg. 1, and Wilcoxon) in terms of Root Mean Square Error (RMSE) as a function of a parameter 'n'. The RMSE is a common metric for evaluating the accuracy of a model or algorithm; a lower RMSE generally indicates better performance.
The data suggests a clear hierarchy of performance: **Wilcoxon** is the most accurate, followed by **Alg. 1**, then **MOSUM**, and finally **CUSUM** is the least accurate among the tested algorithms. The stability of the Wilcoxon algorithm, with its consistently low RMSE, makes it a highly reliable choice. Alg. 1 also shows good stability, with a slight increase in error as 'n' grows, which might be acceptable depending on the application's tolerance for error.
The behavior of CUSUM and MOSUM, with their RMSE peaking around n=500 and then decreasing, is particularly interesting. This could imply that for these specific algorithms, there's an optimal range of 'n' for performance, and values significantly deviating from this optimum (either lower or higher) might lead to increased error. This non-monotonic trend warrants further investigation into the underlying mechanisms of these algorithms.
In essence, the chart provides valuable insights for selecting the most appropriate algorithm based on the desired level of accuracy and the expected range of the parameter 'n'. For applications prioritizing accuracy, Wilcoxon is the clear frontrunner. For scenarios where a slight increase in error is tolerable for potentially other benefits (not shown here), Alg. 1 is a strong contender. The performance characteristics of CUSUM and MOSUM suggest they might be more sensitive to the choice of 'n' and require careful tuning.