# Technical Document Extraction: Line Chart Analysis
## Chart Overview
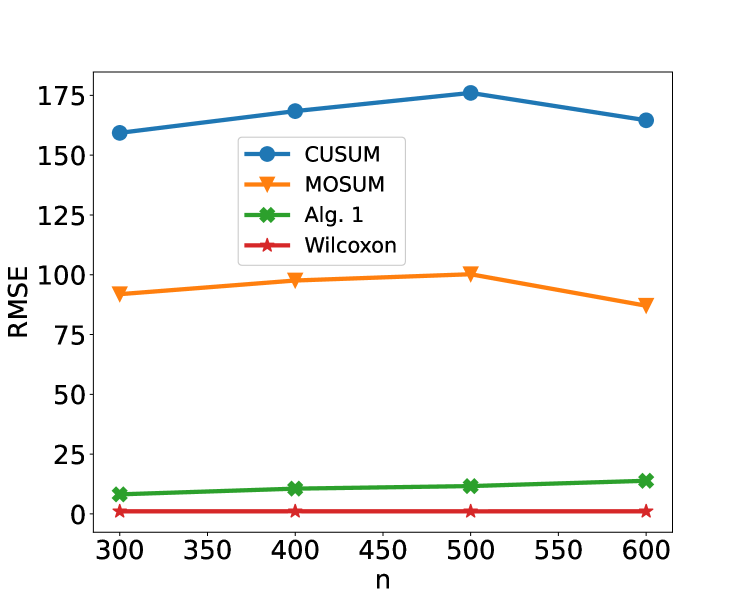
The image depicts a line chart comparing the Root Mean Square Error (RMSE) performance of four statistical algorithms across varying sample sizes (`n`). The chart includes four data series, each represented by distinct line styles and markers.
---
### **Axis Labels and Scales**
- **X-axis (Horizontal):**
- Label: `n` (sample size)
- Range: 300 to 600 (increments of 50)
- Ticks: 300, 350, 400, 450, 500, 550, 600
- **Y-axis (Vertical):**
- Label: `RMSE` (Root Mean Square Error)
- Range: 0 to 175 (increments of 25)
- Ticks: 0, 25, 50, 75, 100, 125, 150, 175
---
### **Legend and Data Series**
The legend is positioned in the **upper-right quadrant** of the chart. Colors and markers are explicitly mapped as follows:
1. **CUSUM** (Blue line with circular markers)
2. **MOSUM** (Orange line with triangular markers)
3. **Alg. 1** (Green line with cross markers)
4. **Wilcoxon** (Red line with star markers)
---
### **Data Series Analysis**
#### 1. **CUSUM (Blue Line)**
- **Trend:**
- Starts at ~155 RMSE when `n=300`.
- Increases steadily to a peak of ~175 RMSE at `n=500`.
- Declines slightly to ~165 RMSE at `n=600`.
- **Key Points:**
- `n=300`: 155
- `n=400`: 165
- `n=500`: 175
- `n=600`: 165
#### 2. **MOSUM (Orange Line)**
- **Trend:**
- Starts at ~90 RMSE when `n=300`.
- Increases to ~100 RMSE at `n=500`.
- Declines to ~85 RMSE at `n=600`.
- **Key Points:**
- `n=300`: 90
- `n=400`: 95
- `n=500`: 100
- `n=600`: 85
#### 3. **Alg. 1 (Green Line)**
- **Trend:**
- Remains relatively flat with a slight upward slope.
- Starts at ~5 RMSE when `n=300`.
- Increases to ~12 RMSE at `n=600`.
- **Key Points:**
- `n=300`: 5
- `n=400`: 8
- `n=500`: 10
- `n=600`: 12
#### 4. **Wilcoxon (Red Line)**
- **Trend:**
- Completely flat across all `n` values.
- Maintains a constant RMSE of ~0.
- **Key Points:**
- `n=300`: 0
- `n=400`: 0
- `n=500`: 0
- `n=600`: 0
---
### **Spatial Grounding and Validation**
- **Legend Placement:** Upper-right quadrant (confirmed via visual inspection).
- **Color-Marker Consistency:**
- Blue circles (CUSUM) match legend.
- Orange triangles (MOSUM) match legend.
- Green crosses (Alg. 1) match legend.
- Red stars (Wilcoxon) match legend.
---
### **Conclusion**
The chart illustrates performance trends of four algorithms across sample sizes. CUSUM exhibits the highest variability, while Wilcoxon shows no error. MOSUM and Alg. 1 demonstrate moderate performance with opposing trends. All data points align with legend specifications.