## Scatter Plots: Model Accuracy vs. Cost
### Overview
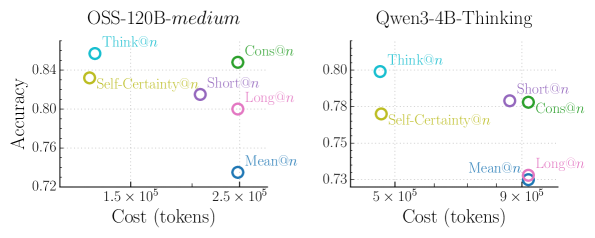
The image presents two scatter plots comparing the accuracy and cost (in tokens) of different reasoning strategies for two language models: OSS-120B-medium and Qwen3-4B-Thinking. Each data point represents a different reasoning strategy, with its color indicating the specific strategy.
### Components/Axes
**Left Plot (OSS-120B-medium):**
* **Title:** OSS-120B-medium
* **Y-axis:** Accuracy, ranging from approximately 0.72 to 0.84. Axis markers are present at 0.72, 0.76, 0.80, and 0.84.
* **X-axis:** Cost (tokens), ranging from approximately 1.5 x 10^5 to 2.5 x 10^5. Axis markers are present at 1.5 x 10^5 and 2.5 x 10^5.
* **Data Points/Reasoning Strategies:**
* Think@n (cyan): Approximately (1.4 x 10^5, 0.85)
* Self-Certainty@n (yellow): Approximately (1.4 x 10^5, 0.83)
* Cons@n (green): Approximately (2.4 x 10^5, 0.85)
* Short@n (purple): Approximately (2.2 x 10^5, 0.82)
* Long@n (pink): Approximately (2.4 x 10^5, 0.80)
* Mean@n (blue): Approximately (2.4 x 10^5, 0.73)
**Right Plot (Qwen3-4B-Thinking):**
* **Title:** Qwen3-4B-Thinking
* **Y-axis:** Accuracy, ranging from approximately 0.73 to 0.80. Axis markers are present at 0.73, 0.75, 0.78, and 0.80.
* **X-axis:** Cost (tokens), ranging from approximately 5 x 10^5 to 9 x 10^5. Axis markers are present at 5 x 10^5 and 9 x 10^5.
* **Data Points/Reasoning Strategies:**
* Think@n (cyan): Approximately (5 x 10^5, 0.80)
* Self-Certainty@n (yellow): Approximately (5 x 10^5, 0.77)
* Cons@n (green): Approximately (9 x 10^5, 0.78)
* Short@n (purple): Approximately (9 x 10^5, 0.78)
* Long@n (pink): Approximately (9 x 10^5, 0.73)
* Mean@n (blue): Approximately (9 x 10^5, 0.73)
### Detailed Analysis
**OSS-120B-medium:**
* The "Think@n" strategy has the highest accuracy and lowest cost among the strategies tested.
* "Mean@n" strategy has the lowest accuracy and a high cost.
* The other strategies ("Self-Certainty@n", "Cons@n", "Short@n", "Long@n") have intermediate accuracy and cost values.
**Qwen3-4B-Thinking:**
* The "Think@n" strategy has the highest accuracy and lowest cost among the strategies tested.
* "Mean@n" and "Long@n" strategies have the lowest accuracy and a high cost.
* The other strategies ("Self-Certainty@n", "Cons@n", "Short@n") have intermediate accuracy and cost values.
### Key Observations
* For both models, the "Think@n" strategy appears to be the most efficient, providing the highest accuracy at a relatively lower cost.
* The "Mean@n" strategy consistently shows the lowest accuracy for both models.
* The cost (tokens) is significantly higher for Qwen3-4B-Thinking compared to OSS-120B-medium across all reasoning strategies.
### Interpretation
The scatter plots illustrate the trade-off between accuracy and cost for different reasoning strategies applied to two language models. The data suggests that the choice of reasoning strategy can significantly impact both the accuracy and the computational cost (measured in tokens) of the model. The "Think@n" strategy seems to be a good choice for both models, offering a balance between accuracy and cost. The higher cost for Qwen3-4B-Thinking might indicate a more complex or resource-intensive reasoning process compared to OSS-120B-medium. The plots allow for a visual comparison of the efficiency of different reasoning approaches for each model.