\n
## Scatter Plots: Model Performance Comparison
### Overview
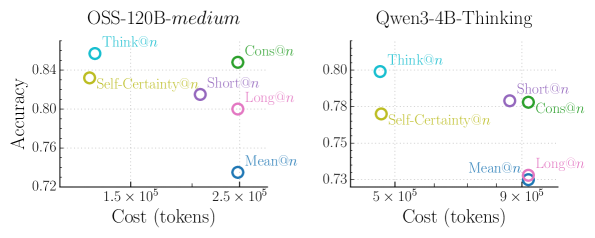
The image presents two scatter plots comparing the performance of two language models, OSS-120B-medium and Qwen-3-4B-Thinking, across different prompting strategies ("Think", "Cons", "Self-Certainty", "Short", "Long", "Mean"). The plots visualize the relationship between "Cost (tokens)" and "Accuracy" for each model and prompting strategy.
### Components/Axes
* **X-axis:** Cost (tokens), ranging from approximately 1.5 x 10<sup>5</sup> to 2.5 x 10<sup>5</sup> for the left plot (OSS-120B-medium) and approximately 5 x 10<sup>5</sup> to 9 x 10<sup>5</sup> for the right plot (Qwen-3-4B-Thinking).
* **Y-axis:** Accuracy, ranging from approximately 0.72 to 0.85 for the left plot and approximately 0.72 to 0.81 for the right plot.
* **Models:** OSS-120B-medium (left plot), Qwen-3-4B-Thinking (right plot).
* **Prompting Strategies (Legend):**
* Think@n (Light Blue)
* Cons@n (Green)
* Self-Certainty@n (Orange)
* Short@n (Violet)
* Long@n (Pink)
* Mean@n (Blue)
### Detailed Analysis or Content Details
**OSS-120B-medium (Left Plot):**
* **Think@n:** Located at approximately (1.6 x 10<sup>5</sup>, 0.84).
* **Cons@n:** Located at approximately (2.3 x 10<sup>5</sup>, 0.84).
* **Self-Certainty@n:** Located at approximately (1.55 x 10<sup>5</sup>, 0.81).
* **Short@n:** Located at approximately (2.4 x 10<sup>5</sup>, 0.80).
* **Long@n:** Located at approximately (2.5 x 10<sup>5</sup>, 0.78).
* **Mean@n:** Located at approximately (2.3 x 10<sup>5</sup>, 0.73).
**Qwen-3-4B-Thinking (Right Plot):**
* **Think@n:** Located at approximately (5.2 x 10<sup>5</sup>, 0.80).
* **Cons@n:** Located at approximately (8.8 x 10<sup>5</sup>, 0.78).
* **Self-Certainty@n:** Located at approximately (5.1 x 10<sup>5</sup>, 0.77).
* **Short@n:** Located at approximately (8.5 x 10<sup>5</sup>, 0.78).
* **Long@n:** Located at approximately (9.1 x 10<sup>5</sup>, 0.74).
* **Mean@n:** Located at approximately (6.0 x 10<sup>5</sup>, 0.73).
**Trends:**
* **OSS-120B-medium:** There isn't a strong linear trend. Accuracy is relatively high across most prompting strategies, with a slight decrease as cost increases.
* **Qwen-3-4B-Thinking:** Similar to OSS-120B-medium, there isn't a strong linear trend. Accuracy is generally lower than OSS-120B-medium, and there's a slight decrease in accuracy with increasing cost.
### Key Observations
* OSS-120B-medium generally achieves higher accuracy than Qwen-3-4B-Thinking across all prompting strategies.
* For both models, the "Think@n" prompting strategy appears to yield the highest accuracy.
* The "Mean@n" prompting strategy consistently results in the lowest accuracy for both models.
* The cost (tokens) varies significantly across prompting strategies, particularly for Qwen-3-4B-Thinking.
### Interpretation
The data suggests that OSS-120B-medium is a more accurate model than Qwen-3-4B-Thinking, based on the observed accuracy scores. The "Think@n" prompting strategy appears to be the most effective for both models, potentially indicating that encouraging the model to "think step-by-step" improves performance. The "Mean@n" strategy consistently underperforms, suggesting that averaging outputs might not be a beneficial approach.
The difference in cost (tokens) between prompting strategies highlights a trade-off between accuracy and computational expense. Choosing the optimal prompting strategy involves balancing the desired level of accuracy with the available resources. The fact that Qwen-3-4B-Thinking requires significantly more tokens to achieve comparable (though lower) accuracy suggests it is less efficient than OSS-120B-medium.
The scatter plots provide a visual representation of this trade-off, allowing for a quick comparison of the performance characteristics of each model and prompting strategy. The lack of strong linear trends suggests that the relationship between cost and accuracy is complex and may be influenced by other factors not captured in this analysis.