## Diagram: Control Systems Overview
### Overview
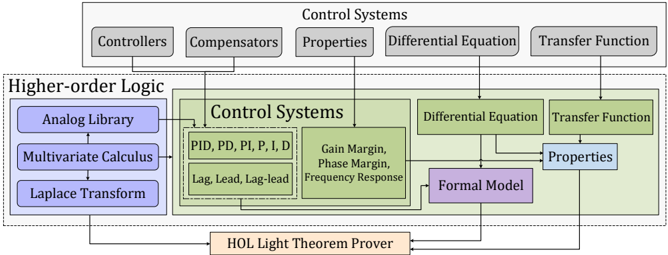
The image is a diagram illustrating the relationships between different components in control systems, higher-order logic, and a theorem prover. It shows how various elements like controllers, compensators, differential equations, and transfer functions are interconnected and how they relate to formal models and properties.
### Components/Axes
The diagram is structured into several key components:
* **Top Layer:** Contains "Controllers", "Compensators", "Properties", "Differential Equation", and "Transfer Function". These are represented as gray rounded rectangles.
* **Middle Layer (Higher-order Logic):** Enclosed in a dashed-line rectangle, this section contains "Analog Library", "Multivariate Calculus", "Laplace Transform" (all in blue), "Control Systems" (in green), "PID, PD, PI, P, I, D" and "Lag, Lead, Lag-lead" (within the "Control Systems" box), "Gain Margin, Phase Margin, Frequency Response" (also within the "Control Systems" box), "Differential Equation", "Transfer Function" (both in green), "Formal Model" (in purple), and "Properties" (in blue).
* **Bottom Layer:** Contains "HOL Light Theorem Prover" (in orange).
### Detailed Analysis or ### Content Details
* **Top Layer:**
* "Controllers": Located at the top-left.
* "Compensators": Located to the right of "Controllers".
* "Properties": Located to the right of "Compensators".
* "Differential Equation": Located to the right of "Properties".
* "Transfer Function": Located at the top-right.
* **Middle Layer (Higher-order Logic):**
* "Analog Library": Located at the left, within the "Higher-order Logic" box.
* "Multivariate Calculus": Located below "Analog Library".
* "Laplace Transform": Located below "Multivariate Calculus".
* "Control Systems": A large green box in the center, containing:
* "PID, PD, PI, P, I, D": Located within the "Control Systems" box.
* "Lag, Lead, Lag-lead": Located below "PID, PD, PI, P, I, D" within the "Control Systems" box.
* "Gain Margin, Phase Margin, Frequency Response": Located to the right of the other two within the "Control Systems" box.
* "Differential Equation": Located to the right of "Control Systems".
* "Transfer Function": Located to the right of "Differential Equation".
* "Formal Model": Located below "Differential Equation" and "Transfer Function".
* "Properties": Located to the right of "Formal Model".
* **Bottom Layer:**
* "HOL Light Theorem Prover": Located at the bottom, spanning the width of the diagram.
* **Connections:**
* Arrows connect "Analog Library", "Multivariate Calculus", and "Laplace Transform" to "Control Systems".
* Arrows connect "Control Systems" to "Differential Equation", "Transfer Function", and "Formal Model".
* Arrows connect "Differential Equation" and "Transfer Function" to "Properties".
* Arrows connect "Controllers", "Compensators", "Properties", "Differential Equation", and "Transfer Function" from the top layer to the "Control Systems" box in the middle layer.
* Arrows connect "Formal Model" and "Properties" to "HOL Light Theorem Prover".
* Arrows connect "Analog Library", "Multivariate Calculus", and "Laplace Transform" to "HOL Light Theorem Prover".
### Key Observations
* The diagram illustrates a hierarchical structure, with high-level control system components at the top, lower-level logic and mathematical tools in the middle, and a theorem prover at the bottom.
* The "Control Systems" box in the middle layer acts as a central hub, connecting various elements.
* The "HOL Light Theorem Prover" receives input from multiple sources, suggesting its role in verifying or analyzing the control systems.
### Interpretation
The diagram represents a workflow or architecture for designing and verifying control systems. It suggests that higher-order logic and mathematical tools are used to model and analyze control systems, and the "HOL Light Theorem Prover" is used to formally verify the properties of these systems. The connections between the components indicate the flow of information and dependencies between different stages of the design and verification process. The diagram highlights the importance of formal methods in ensuring the correctness and reliability of control systems.