## Diagram: Control Systems and Higher-Order Logic Integration
### Overview
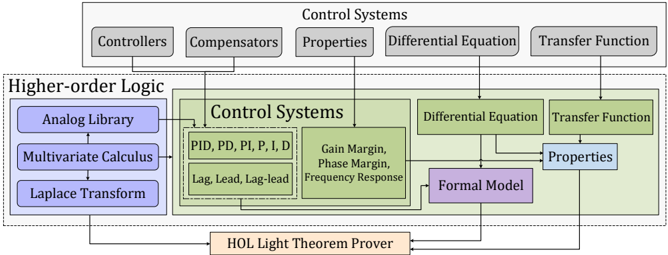
The image is a technical block diagram illustrating the conceptual architecture and relationships between components of control systems theory, higher-order logic, and a formal theorem prover. It depicts how mathematical tools, control system elements, and formal verification methods interconnect.
### Components/Axes
The diagram is organized into several distinct regions and labeled boxes connected by directional arrows.
**Top Row (Control Systems Categories):**
- A gray box labeled **"Control Systems"** spans the top.
- Inside, five gray sub-boxes are arranged horizontally:
1. **Controllers**
2. **Compensators**
3. **Properties**
4. **Differential Equation**
5. **Transfer Function**
**Left Region (Higher-order Logic):**
- A dashed-line box labeled **"Higher-order Logic"** is positioned on the left.
- Inside, three blue boxes are stacked vertically:
1. **Analog Library** (top)
2. **Multivariate Calculus** (middle)
3. **Laplace Transform** (bottom)
**Central Region (Control Systems Core):**
- A large, light-green box labeled **"Control Systems"** occupies the center.
- Inside, it contains:
- A dashed-line sub-box containing two green boxes:
- **PID, PD, PI, P, I, D** (left)
- **Lag, Lead, Lag-lead** (right)
- A green box labeled **Gain Margin, Phase Margin, Frequency Response**.
- A purple box labeled **Formal Model**.
**Right Region (Formal Models):**
- Two green boxes are positioned to the right of the central Control Systems box:
1. **Differential Equation** (top)
2. **Transfer Function** (below Differential Equation)
- A blue box labeled **Properties** is connected to the right of the "Transfer Function" box.
**Bottom Region (Theorem Prover):**
- A single, light-orange box labeled **"HOL Light Theorem Prover"** is centered at the bottom.
**Connections (Arrows):**
Arrows indicate dependencies, inputs, or relationships between components. Key flows include:
- Arrows from **Higher-order Logic** components (Analog Library, Multivariate Calculus, Laplace Transform) point into the central **Control Systems** box.
- Arrows from the top-row **Control Systems** categories (Controllers, Compensators, Properties, Differential Equation, Transfer Function) point into corresponding elements within the central **Control Systems** box and the right-side formal model boxes.
- Arrows connect the central **Control Systems** elements (like the PID box and Gain Margin box) to the **Formal Model**.
- Arrows from **Differential Equation**, **Transfer Function**, and **Properties** on the right point down to the **HOL Light Theorem Prover**.
- An arrow from the **Formal Model** also points to the **HOL Light Theorem Prover**.
### Detailed Analysis
The diagram is a conceptual map, not a data chart. It contains no numerical data, trends, or statistical information. Its purpose is to show structural and logical relationships.
**Component Breakdown:**
1. **Theoretical Foundations (Left):** "Higher-order Logic" provides the mathematical underpinnings: Analog Library, Multivariate Calculus, and Laplace Transform.
2. **Core Control Theory (Center):** The central "Control Systems" block contains practical controller/compensator types (PID family, Lag/Lead networks) and key analysis properties (Gain Margin, Phase Margin, Frequency Response).
3. **Formal Representation (Right):** Control system concepts are expressed as formal mathematical models: "Differential Equation" and "Transfer Function," leading to verifiable "Properties."
4. **Verification Engine (Bottom):** The "HOL Light Theorem Prover" serves as the foundational tool for formally verifying the properties derived from the models.
**Flow and Relationships:**
The flow is generally from left (abstract logic) and top (general categories) into the central applied control system design, then to formal models on the right, and finally down to the theorem prover for verification. This suggests a pipeline from theory to design to formal proof.
### Key Observations
- **Dual "Control Systems" Label:** The term "Control Systems" appears twice: once as a top-level category and once as the central processing block. This indicates the central block is the specific instantiation or application of the general theory.
- **Hierarchy of Abstraction:** The diagram moves from abstract mathematical logic (left) to concrete control elements (center) to formal symbolic models (right) to a specific verification tool (bottom).
- **Central Role of Formal Model:** The "Formal Model" box acts as a convergence point for the practical control elements (PID, Gain Margin) before passing to the theorem prover.
- **Properties as a Bridge:** The "Properties" box appears both as a general category (top) and as a specific output of the formal models (right), highlighting its role as the target for verification.
### Interpretation
This diagram illustrates a framework for the **formal verification of control systems**. It proposes a methodology where:
1. Classical control system design (using PIDs, compensators, and analyzing margins/frequency response) is grounded in higher-order logic and transform calculus.
2. These designed systems are translated into formal mathematical models (differential equations, transfer functions).
3. The desired properties of these models (e.g., stability margins) are then rigorously proven using a dedicated theorem prover (HOL Light).
The underlying message is that reliable, safety-critical control systems can be developed by integrating traditional engineering design with formal methods from computer science and mathematics. The diagram maps the necessary components and their interdependencies to achieve this integration, moving from conceptual tools to a provable artifact.