## Line Graph: Surprisal vs. Training Steps
### Overview
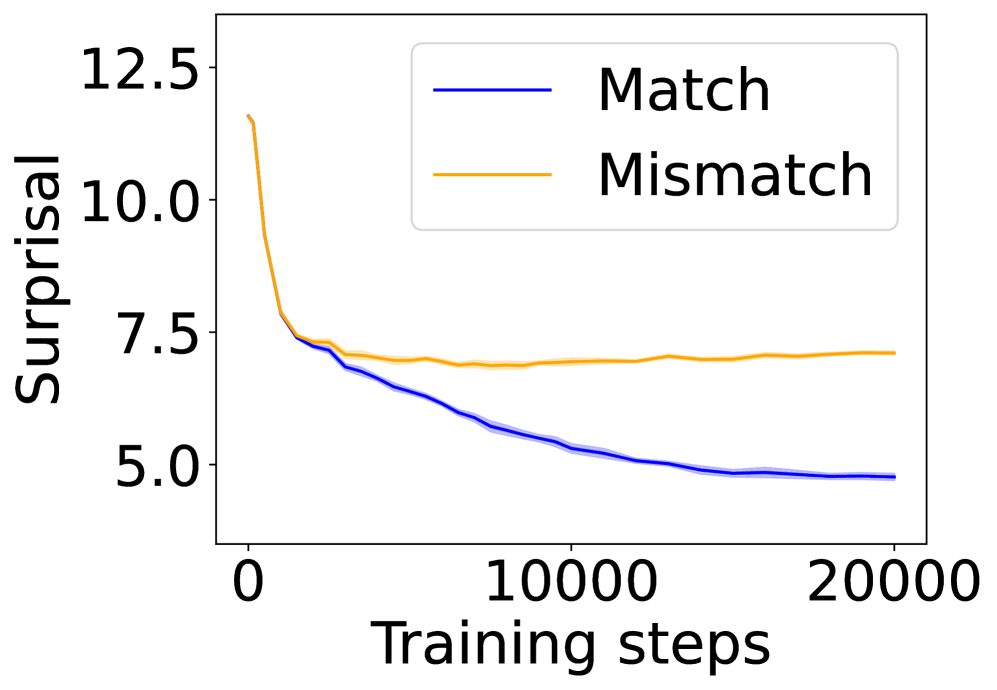
The image depicts a line graph comparing two data series labeled "Match" (blue) and "Mismatch" (orange) across 20,000 training steps. The y-axis measures "Surprisal" (logarithmic scale implied by rapid initial decline), while the x-axis represents training steps. Both lines exhibit distinct trends, with "Match" showing a steep initial decline followed by gradual stabilization, and "Mismatch" demonstrating a more gradual decline with sustained variability.
### Components/Axes
- **Y-axis (Surprisal)**: Ranges from 5.0 to 12.5 in increments of 2.5. No explicit units provided.
- **X-axis (Training steps)**: Spans 0 to 20,000 in increments of 10,000.
- **Legend**: Positioned in the top-right corner, with:
- Blue line: "Match"
- Orange line: "Mismatch"
### Detailed Analysis
1. **Match (Blue Line)**:
- **Initial trend**: Steep decline from ~12.5 (at 0 steps) to ~7.5 (at ~5,000 steps).
- **Midpoint**: ~6.0 at 10,000 steps.
- **Final trend**: Gradual decline to ~5.0 by 20,000 steps.
- **Variability**: Smooth, consistent downward trajectory with minimal noise.
2. **Mismatch (Orange Line)**:
- **Initial trend**: Sharp drop from ~10.0 (at 0 steps) to ~7.5 (at ~2,500 steps).
- **Midpoint**: Stabilizes near ~7.5 between 5,000 and 15,000 steps.
- **Final trend**: Slight upward fluctuation to ~7.7 by 20,000 steps.
- **Variability**: Increased noise after 10,000 steps, with minor oscillations.
### Key Observations
- Both lines share a similar initial decline rate (~2.5 surprisal units in first 5,000 steps), but diverge afterward.
- "Match" maintains a steeper, more consistent decline throughout training.
- "Mismatch" plateaus after ~5,000 steps, with a slight uptick in later stages.
- No overlapping data points between the two lines after 5,000 steps.
### Interpretation
The graph suggests that the "Match" condition demonstrates a more sustained reduction in surprisal over training, potentially indicating better adaptation or learning efficiency. The "Mismatch" condition shows initial sensitivity to training but reaches a performance ceiling, with later fluctuations possibly reflecting instability or suboptimal convergence. The logarithmic-like decline in "Match" implies exponential improvement in early stages, while the plateau in "Mismatch" may highlight inherent limitations in the mismatch scenario. These trends could reflect differences in algorithmic behavior, data alignment, or task difficulty between the two conditions.