\n
## Line Chart: Surprisal vs. Training Steps
### Overview
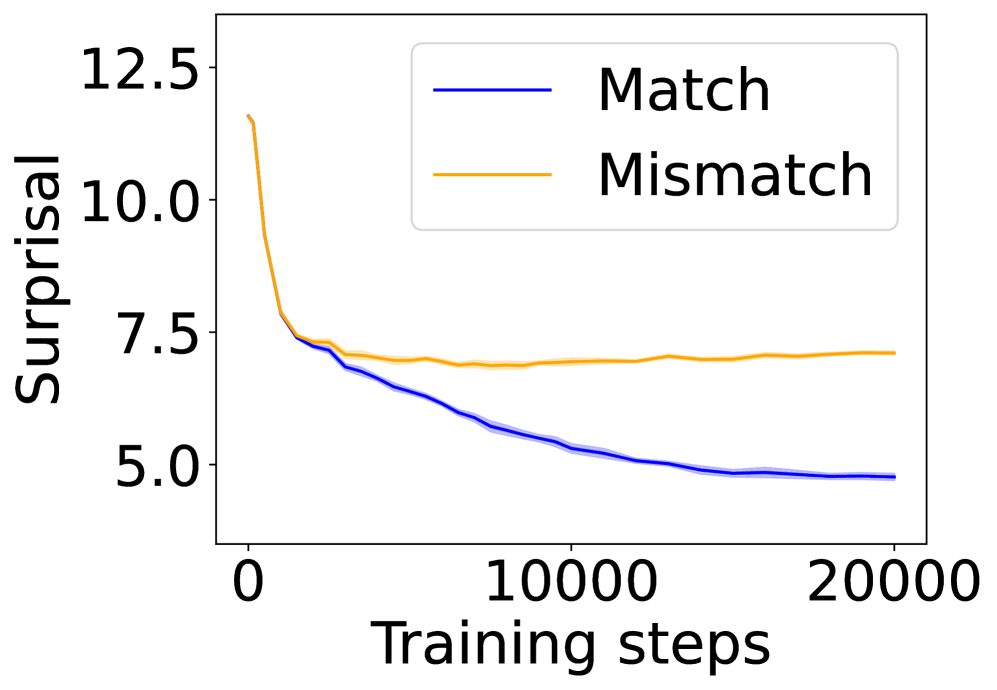
The image presents a line chart illustrating the relationship between "Surprisal" (y-axis) and "Training steps" (x-axis). Two data series are plotted: one representing "Match" and the other "Mismatch" conditions. The chart appears to track the change in surprisal during a training process.
### Components/Axes
* **X-axis:** "Training steps", ranging from approximately 0 to 20000. The axis is linearly scaled.
* **Y-axis:** "Surprisal", ranging from approximately 4.5 to 12.5. The axis is linearly scaled.
* **Legend:** Located in the top-right corner of the chart.
* "Match" - represented by a blue line.
* "Mismatch" - represented by an orange line.
### Detailed Analysis
The "Match" line (blue) starts at approximately 5.2 and exhibits a generally downward trend, decreasing to approximately 4.7 by 20000 training steps. The slope is initially steeper, then becomes more gradual.
The "Mismatch" line (orange) begins at approximately 11.5 and initially decreases rapidly to around 7.5 by 5000 training steps. After this initial drop, the line plateaus and fluctuates around a value of approximately 7.0, with minor oscillations, until 20000 training steps.
Here's a breakdown of approximate data points:
**Match (Blue Line):**
* 0 Training Steps: ~5.2 Surprisal
* 5000 Training Steps: ~5.0 Surprisal
* 10000 Training Steps: ~4.9 Surprisal
* 15000 Training Steps: ~4.8 Surprisal
* 20000 Training Steps: ~4.7 Surprisal
**Mismatch (Orange Line):**
* 0 Training Steps: ~11.5 Surprisal
* 5000 Training Steps: ~7.5 Surprisal
* 10000 Training Steps: ~7.1 Surprisal
* 15000 Training Steps: ~7.0 Surprisal
* 20000 Training Steps: ~7.0 Surprisal
### Key Observations
* The "Mismatch" condition starts with a significantly higher surprisal value than the "Match" condition.
* Both conditions exhibit a decrease in surprisal over time, indicating learning or adaptation during the training process.
* The "Match" condition shows a more consistent and steady decrease in surprisal.
* The "Mismatch" condition's surprisal decreases rapidly initially, then stabilizes, suggesting a point of diminishing returns or convergence.
### Interpretation
The chart likely represents the surprisal (a measure of how unexpected an event is) of a model's predictions under two conditions: "Match" and "Mismatch". "Match" likely refers to a scenario where the input data aligns with the model's expectations, while "Mismatch" represents a scenario where the input data deviates from those expectations.
The decreasing surprisal for both conditions suggests that the model is learning to better predict the data over time. The higher initial surprisal for the "Mismatch" condition indicates that the model initially finds these scenarios more unexpected. The stabilization of the "Mismatch" surprisal suggests that the model has reached a limit in its ability to handle these deviations, or that the training process has converged on a solution that doesn't further reduce surprisal for mismatched data.
The difference in the final surprisal values between the two conditions suggests that the model is still better at predicting "Match" scenarios than "Mismatch" scenarios, even after 20000 training steps. This could indicate a bias in the training data or a limitation in the model's capacity to generalize to mismatched data.