## Chart Type: Time Series Plots of Impulse Responses for Four Microphones
### Overview
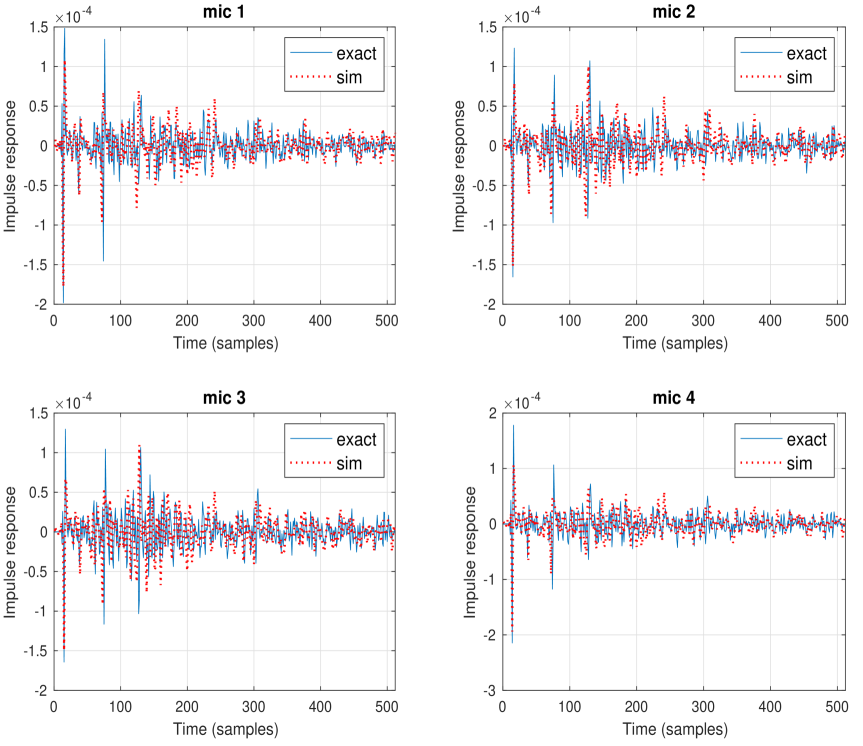
The image presents four time series plots, each displaying the impulse response of a different microphone (mic 1, mic 2, mic 3, and mic 4). Each plot shows two curves: an "exact" response (solid blue line) and a "sim" response (dotted red line). The x-axis represents time in samples, ranging from 0 to 500. The y-axis represents the impulse response, scaled by a factor of 10^-4. The plots compare the exact and simulated impulse responses for each microphone.
### Components/Axes
* **Titles:** Each plot has a title indicating the microphone number (mic 1, mic 2, mic 3, mic 4).
* **X-axis:**
* Label: "Time (samples)"
* Range: 0 to 500, with tick marks at intervals of 100.
* **Y-axis:**
* Label: "Impulse response"
* Scale factor: ×10^-4
* Mic 1: Range: -2 to 1.5
* Mic 2: Range: -2 to 1.5
* Mic 3: Range: -2 to 1.5
* Mic 4: Range: -3 to 2
* Tick marks are present at intervals of 0.5.
* **Legend:** Located in the top-right corner of each subplot.
* "exact": Solid blue line
* "sim": Dotted red line
### Detailed Analysis
**General Trend:**
For all four microphones, both the "exact" and "sim" impulse responses exhibit a rapid initial response followed by a decay towards zero. The "sim" response generally follows the "exact" response but with some deviations, particularly in the initial transient period.
**Mic 1:**
* The "exact" response (blue) starts near 0, has a large negative spike around sample 50, and then oscillates around 0 with decreasing amplitude.
* The "sim" response (red) closely follows the "exact" response, but with slightly higher amplitude oscillations.
* The impulse response ranges from approximately -1.75 x 10^-4 to 1.4 x 10^-4.
**Mic 2:**
* The "exact" response (blue) starts near 0, has a large negative spike around sample 50, and then oscillates around 0 with decreasing amplitude.
* The "sim" response (red) closely follows the "exact" response, but with slightly higher amplitude oscillations.
* The impulse response ranges from approximately -1.75 x 10^-4 to 1.4 x 10^-4.
**Mic 3:**
* The "exact" response (blue) starts near 0, has a large negative spike around sample 50, and then oscillates around 0 with decreasing amplitude.
* The "sim" response (red) closely follows the "exact" response, but with slightly higher amplitude oscillations.
* The impulse response ranges from approximately -1.75 x 10^-4 to 1.4 x 10^-4.
**Mic 4:**
* The "exact" response (blue) starts near 0, has a large negative spike around sample 50, and then oscillates around 0 with decreasing amplitude.
* The "sim" response (red) closely follows the "exact" response, but with slightly higher amplitude oscillations.
* The impulse response ranges from approximately -2.75 x 10^-4 to 1.9 x 10^-4.
### Key Observations
* The "exact" and "sim" responses are generally in good agreement, suggesting the simulation accurately captures the behavior of the microphones.
* The initial transient response is more pronounced and shows greater deviation between the "exact" and "sim" responses.
* The impulse response decays towards zero as time increases, indicating that the system is stable.
* Mic 4 has a larger impulse response range compared to the other microphones.
### Interpretation
The plots compare the "exact" and "simulated" impulse responses of four microphones. The close agreement between the two responses suggests that the simulation model is a good representation of the actual microphone behavior. The differences in the initial transient response could be due to simplifications or approximations in the simulation model. The decay of the impulse response over time indicates that the system is stable and that any initial disturbance will eventually die out. The larger impulse response range for Mic 4 suggests that it may be more sensitive or have a different frequency response compared to the other microphones.