## Flowchart Diagram: Machine Learning Pipeline for Rainfall Prediction
### Overview
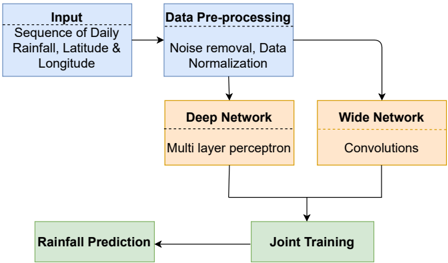
The diagram illustrates a machine learning pipeline for rainfall prediction, showing data flow from input to final prediction. It includes data preprocessing, dual neural network architectures, joint training, and output generation.
### Components/Axes
1. **Input Box** (Light Blue)
- Label: "Input"
- Content: "Sequence of Daily Rainfall, Latitude & Longitude"
2. **Data Pre-processing Box** (Light Blue)
- Label: "Data Pre-processing"
- Sub-components:
- "Noise removal"
- "Data Normalization"
3. **Deep Network Box** (Orange)
- Label: "Deep Network"
- Sub-component: "Multi layer perceptron"
4. **Wide Network Box** (Orange)
- Label: "Wide Network"
- Sub-component: "Convolutions"
5. **Joint Training Box** (Green)
- Label: "Joint Training"
6. **Rainfall Prediction Box** (Green)
- Label: "Rainfall Prediction"
### Flow Connections
- Input → Data Pre-processing → [Deep Network & Wide Network] → Joint Training → Rainfall Prediction
- Dual pathways from Data Pre-processing to both network types
- Convergence of network outputs into Joint Training
### Key Observations
1. **Dual Architecture Integration**: Combines deep learning (MLP) and wide learning (convolutions) approaches
2. **Joint Training Phase**: Explicitly connects both network outputs before final prediction
3. **Spatial Data Handling**: Explicit inclusion of geographic coordinates (latitude/longitude) in input
4. **Temporal Component**: "Sequence of Daily Rainfall" indicates time-series data processing
### Interpretation
This pipeline demonstrates a hybrid approach to rainfall prediction:
1. **Data Preparation**: Standard preprocessing steps (noise removal, normalization) ensure clean input data
2. **Feature Extraction**:
- Deep Network (MLP) likely captures complex nonlinear relationships
- Wide Network (convolutions) probably handles spatial pattern recognition
3. **Synergistic Training**: Joint training phase suggests knowledge sharing between architectures
4. **Geospatial-Temporal Modeling**: Combines location data with time-series analysis for improved predictions
The architecture appears designed to leverage both local patterns (via convolutions) and global relationships (via MLP) while maintaining temporal coherence through joint training. The explicit inclusion of geographic coordinates suggests the model accounts for regional climate variations in its predictions.