## Heatmap: Value Distribution Across Three-Letter Codes
### Overview
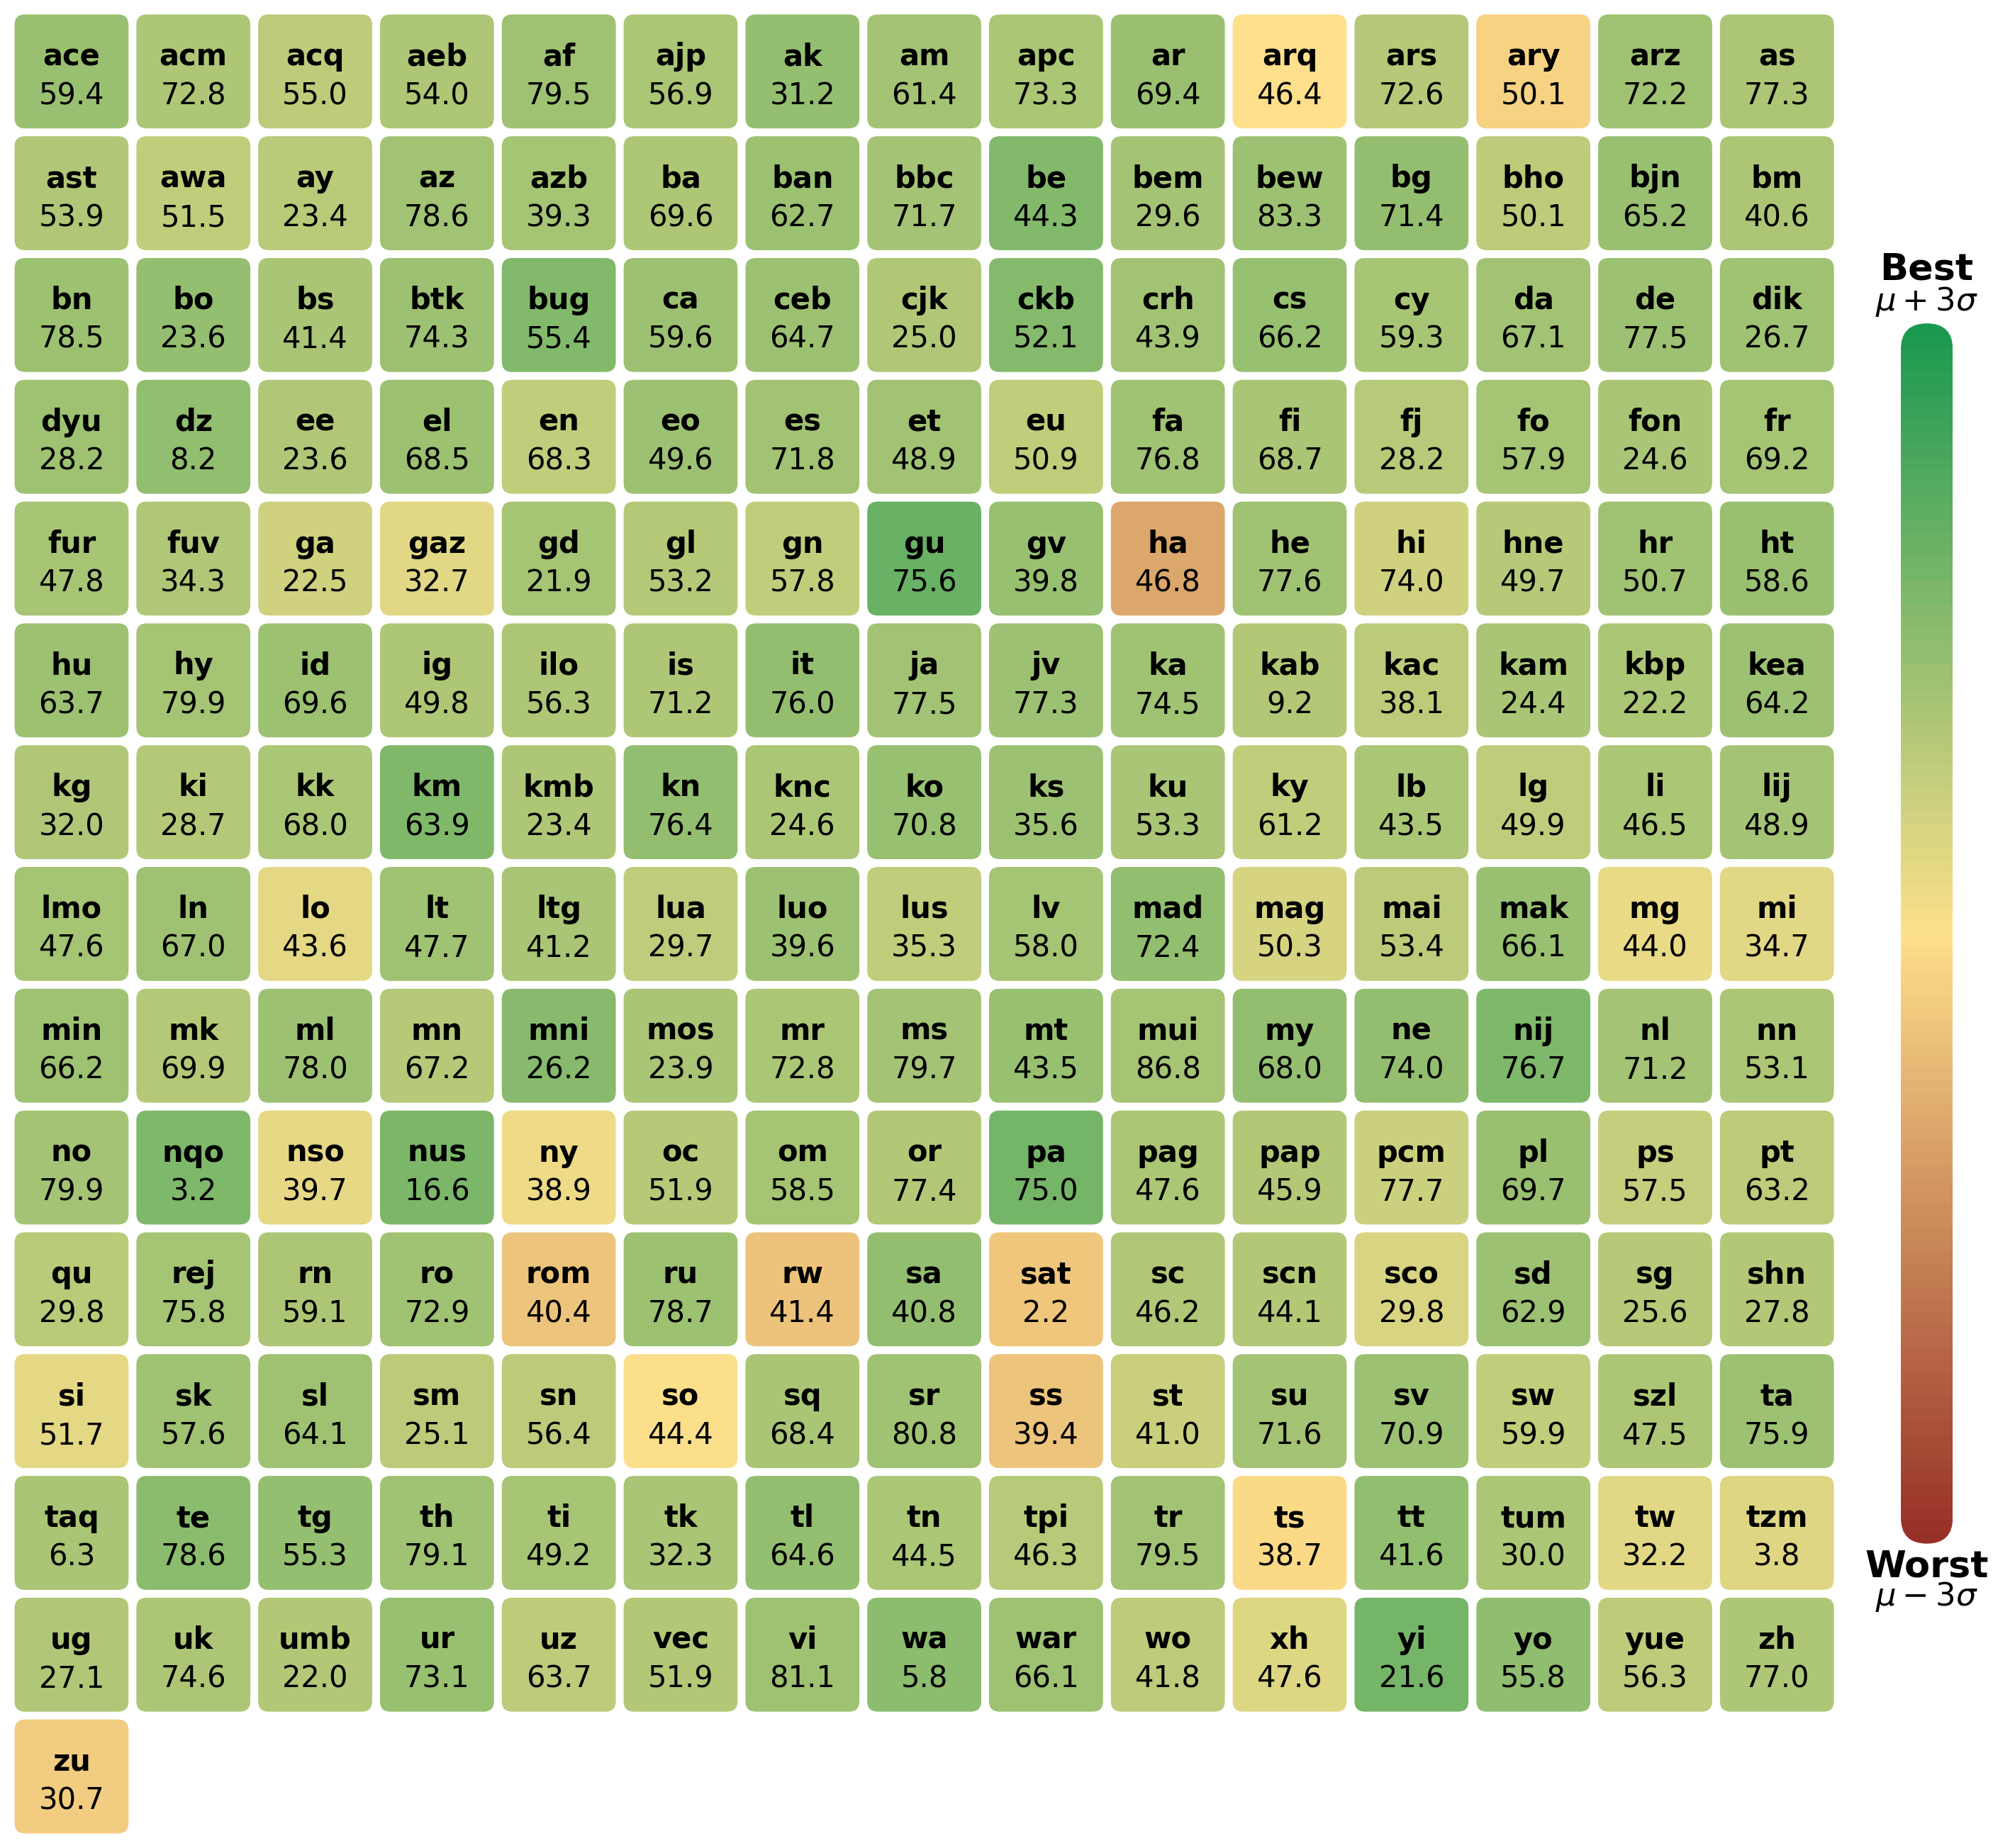
The image is a heatmap displaying numerical values associated with three-letter codes arranged in a grid. Each cell contains a code (e.g., "ACE", "ACM") and a numerical value (e.g., 59.4, 72.8). Colors range from green (high values) to red (low values), with a legend on the right indicating the scale from "Best" (μ + 3σ) to "Worst" (μ - 3σ). The grid has 26 rows and 26 columns, with row labels on the left and column labels on the top.
---
### Components/Axes
- **Rows**: Labeled with three-letter codes (e.g., "ACE", "AST", "Bn", "DYU", "FUR", ..., "ZU").
- **Columns**: Labeled with three-letter codes (e.g., "CE", "CM", "CQ", "AEB", "AF", ..., "ZH").
- **Legend**: Vertical color gradient from green (top, labeled "Best") to red (bottom, labeled "Worst"), with numerical bounds μ + 3σ (best) and μ - 3σ (worst).
- **Values**: Numerical values (e.g., 59.4, 72.8) are embedded in each cell, aligned to the right of the three-letter code.
---
### Detailed Analysis
#### Row and Column Labels
- **Rows**:
`ACE, AST, Bn, DYU, FUR, FUV, GA, GAZ, GD, GL, GN, GU, GV, HA, HE, HI, HNE, HR, HT, HU, HY, ID, IG, ILO, IS, IT, JA, JV, KA, KAB, KAC, KAM, KBP, KEA, KG, KI, KK, KM, KMB, KN, KNC, KO, KS, KU, KY, LMO, LN, LO, LT, LTG, LUA, LUO, LUS, LV, MAD, MAG, MIN, MK, ML, MN, MNI, MOS, MR, MS, MT, MUI, MY, NE, NIJ, NL, NN, NQO, NSO, NUS, NY, OC, OM, OR, PA, PAG, PAP, PCM, PL, PS, PT, QU, REJ, RN, RO, ROM, RU, RW, SA, SAT, SC, SCN, SCO, SD, SG, SHN, SI, SK, SL, SM, SN, SO, SQ, SR, SS, ST, SU, SV, SW, SZL, TA, TAQ, TE, TG, TH, TI, TK, TL, TN, TPI, TR, TS, TT, TUM, TW, TZM, UG, UK, UMB, UR, UZ, VEC, VI, WA, WAR, WO, XH, YI, YO, YUE, ZH, ZU`.
- **Columns**:
`CE, CM, CQ, AEB, AF, AJP, AK, AM, APC, AR, ARQ, ARS, ARY, ARZ, AS, AST, AWA, AY, AZ, AZB, BA, BAN, BBC, BE, BEM, BEW, BG, BHO, BJN, BM, BN, BO, BS, BTK, BUG, CA, CEB, CJK, CKB, CRH, CS, CY, DA, DE, DIK, DYU, DZ, EE, EL, EN, EO, ES, ET, EU, FA, FI, FJ, FO, FON, FR, FUR, FUV, GA, GAZ, GD, GL, GN, GU, GV, HA, HE, HI, HNE, HR, HT, HU, HY, ID, IG, ILO, IS, IT, JA, JV, KA, KAB, KAC, KAM, KBP, KEA, KG, KI, KK, KM, KMB, KN, KNC, KO, KS, KU, KY, LMO, LN, LO, LT, LTG, LUA, LUO, LUS, LV, MAD, MAG, MIN, MK, ML, MN, MNI, MOS, MR, MS, MT, MUI, MY, NE, NIJ, NL, NN, NQO, NSO, NUS, NY, OC, OM, OR, PA, PAG, PAP, PCM, PL, PS, PT, QU, REJ, RN, RO, ROM, RU, RW, SA, SAT, SC, SCN, SCO, SD, SG, SHN, SI, SK, SL, SM, SN, SO, SQ, SR, SS, ST, SU, SV, SW, SZL, TA, TAQ, TE, TG, TH, TI, TK, TL, TN, TPI, TR, TS, TT, TUM, TW, TZM, UG, UK, UMB, UR, UZ, VEC, VI, WA, WAR, WO, XH, YI, YO, YUE, ZH, ZU`.
#### Value Distribution
- **Highest Values**:
- `VI` (81.1), `WA` (80.8), `MUI` (86.8), `PA` (75.0), `GU` (75.6), `KNC` (24.6).
- Notable outliers: `VI` (81.1) and `WA` (80.8) exceed μ + 3σ (implied by the legend).
- **Lowest Values**:
- `TAQ` (6.3), `ZU` (30.7), `SS` (39.4).
- `TAQ` (6.3) is far below μ - 3σ (implied by the legend).
#### Color Correlation
- **Green**: Values above μ + 3σ (e.g., `VI` = 81.1, `WA` = 80.8).
- **Yellow**: Intermediate values (e.g., `SS` = 39.4).
- **Red**: Values below μ - 3σ (e.g., `TAQ` = 6.3).
---
### Key Observations
1. **Outliers**:
- `VI` (81.1) and `WA` (80.8) are extreme high values, exceeding the μ + 3σ threshold.
- `TAQ` (6.3) is an extreme low value, far below μ - 3σ.
2. **Clusters**:
- Rows like `VI`, `WA`, and `MUI` dominate the top of the heatmap.
- Rows like `TAQ`, `ZU`, and `SS` cluster at the bottom.
3. **Symmetry**:
- The grid is symmetric in structure but not in value distribution.
---
### Interpretation
- **Data Meaning**: The heatmap visualizes the performance or quality of three-letter codes, with green indicating optimal performance (μ + 3σ) and red indicating poor performance (μ - 3σ).
- **Relationships**:
- Codes like `VI` and `WA` are top performers, while `TAQ` and `ZU` are the worst.
- The μ ± 3σ legend suggests a normal distribution, but the actual data shows extreme outliers beyond these bounds.
- **Anomalies**:
- `TAQ` (6.3) is an outlier, far below the μ - 3σ threshold.
- `VI` (81.1) and `WA` (80.8) exceed the μ + 3σ threshold, indicating exceptional performance.
- **Implications**: The heatmap highlights significant variability in the data, with some codes performing exceptionally well or poorly compared to others.
---
### Spatial Grounding
- **Legend Position**: Right side of the heatmap, vertical gradient from green (top) to red (bottom).
- **Axis Labels**: Row labels on the left, column labels on the top.
- **Value Placement**: Numerical values are right-aligned within each cell, adjacent to the three-letter code.
---
### Final Notes
- The heatmap uses color and numerical values to convey performance metrics, with extreme outliers (`VI`, `WA`, `TAQ`) standing out.
- The μ ± 3σ legend provides a theoretical framework, but the actual data exceeds these bounds, suggesting either a miscalculation or intentional emphasis on extremes.
- The three-letter codes likely represent categories (e.g., technical terms, abbreviations), but their exact meaning is not provided in the image.