TECHNICAL ASSET FINGERPRINT
61a73b333f8f6134e5f40e4d
Click to view fullscreen
Press ESC or click to close
FOUND IN PAPERS
EXPERT: gemini-2.0-flash VERSION 1
RUNTIME: nugit/gemini/gemini-2.0-flash
INTEL_VERIFIED
## Heatmap: Language Similarity
### Overview
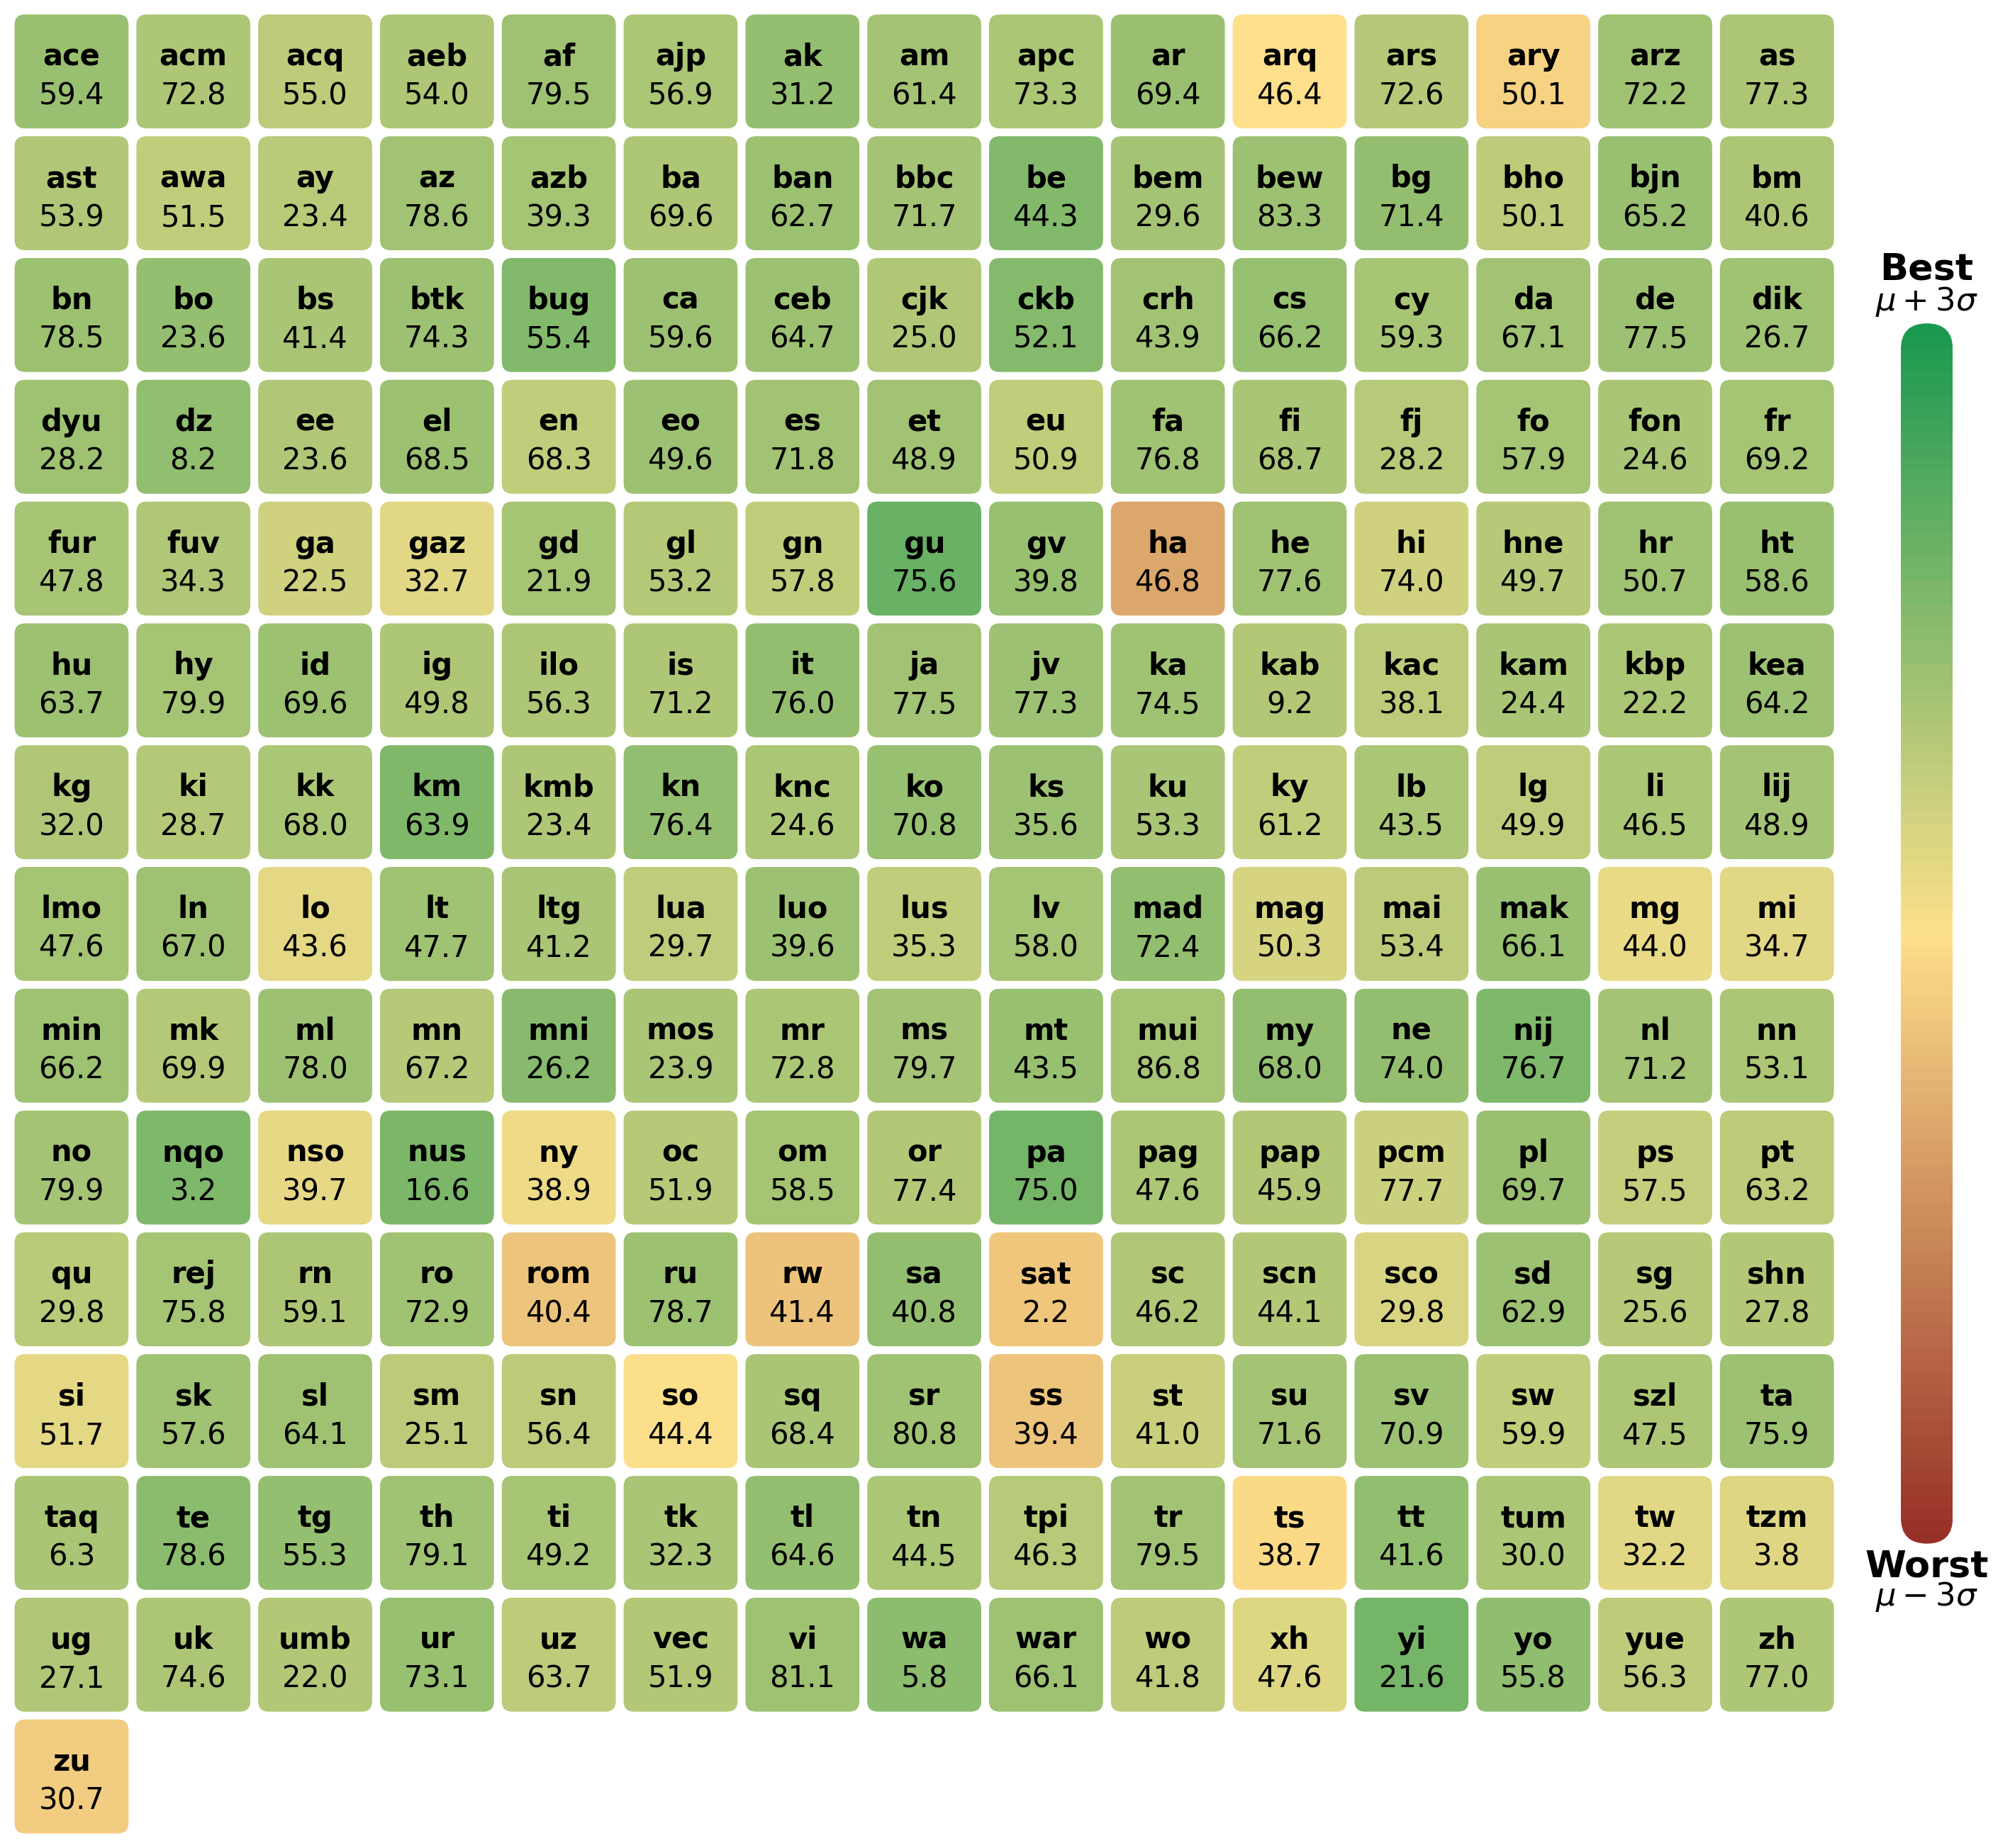
The image is a heatmap displaying similarity scores between different languages. Each cell represents a pair of languages, with the color indicating the degree of similarity. Green shades indicate high similarity, while red/brown shades indicate low similarity. The languages are identified by two- or three-letter codes. A color gradient legend is provided on the right side, ranging from "Worst μ – 3σ" (red/brown) to "Best μ + 3σ" (green).
### Components/Axes
* **Rows and Columns:** Each row and column represents a language, identified by a two- or three-letter code.
* **Color Gradient Legend (Right Side):**
* Top: "Best μ + 3σ" (Green)
* Bottom: "Worst μ – 3σ" (Red/Brown)
* **Cell Values:** Each cell contains a numerical value representing the similarity score between the corresponding row and column languages.
### Detailed Analysis or ### Content Details
Here's a breakdown of the data, organized by language codes and their corresponding similarity scores. Note that the color of the cell is directly related to the value.
* **Top Row:**
* ace: 59.4
* acm: 72.8
* acq: 55.0
* aeb: 54.0
* af: 79.5
* ajp: 56.9
* ak: 31.2
* am: 61.4
* apc: 73.3
* ar: 69.4
* arq: 46.4
* ars: 72.6
* ary: 50.1
* arz: 72.2
* as: 77.3
* **Second Row:**
* ast: 53.9
* awa: 51.5
* ay: 23.4
* az: 78.6
* azb: 39.3
* ba: 69.6
* ban: 62.7
* bbc: 71.7
* be: 44.3
* bem: 29.6
* bew: 83.3
* bg: 71.4
* bho: 50.1
* bjn: 65.2
* bm: 40.6
* **Third Row:**
* bn: 78.5
* bo: 23.6
* bs: 41.4
* btk: 74.3
* bug: 55.4
* ca: 59.6
* ceb: 64.7
* cjk: 25.0
* ckb: 52.1
* crh: 43.9
* cs: 66.2
* cy: 59.3
* da: 67.1
* de: 77.5
* dik: 26.7
* **Fourth Row:**
* dyu: 28.2
* dz: 8.2
* ee: 23.6
* el: 68.5
* en: 68.3
* eo: 49.6
* es: 71.8
* et: 48.9
* eu: 50.9
* fa: 76.8
* fi: 68.7
* fj: 28.2
* fo: 57.9
* fon: 24.6
* fr: 69.2
* **Fifth Row:**
* fur: 47.8
* fuv: 34.3
* ga: 22.5
* gaz: 32.7
* gd: 21.9
* gl: 53.2
* gn: 57.8
* gu: 75.6
* gv: 39.8
* ha: 46.8
* he: 77.6
* hi: 74.0
* hne: 49.7
* hr: 50.7
* ht: 58.6
* **Sixth Row:**
* hu: 63.7
* hy: 79.9
* id: 69.6
* ig: 49.8
* ilo: 56.3
* is: 71.2
* it: 76.0
* ja: 77.5
* jv: 77.3
* ka: 74.5
* kab: 9.2
* kac: 38.1
* kam: 24.4
* kbp: 22.2
* kea: 64.2
* **Seventh Row:**
* kg: 32.0
* ki: 28.7
* kk: 68.0
* km: 63.9
* kmb: 23.4
* kn: 76.4
* knc: 24.6
* ko: 70.8
* ks: 35.6
* ku: 53.3
* ky: 61.2
* lb: 43.5
* lg: 49.9
* li: 46.5
* lij: 48.9
* **Eighth Row:**
* lmo: 47.6
* ln: 67.0
* lo: 43.6
* lt: 47.7
* ltg: 41.2
* lua: 29.7
* luo: 39.6
* lus: 35.3
* lv: 58.0
* mad: 72.4
* mag: 50.3
* mai: 53.4
* mak: 66.1
* mg: 44.0
* mi: 34.7
* **Ninth Row:**
* min: 66.2
* mk: 69.9
* ml: 78.0
* mn: 67.2
* mni: 26.2
* mos: 23.9
* mr: 72.8
* ms: 79.7
* mt: 43.5
* mui: 86.8
* my: 68.0
* ne: 74.0
* nij: 76.7
* nl: 71.2
* nn: 53.1
* **Tenth Row:**
* no: 79.9
* nqo: 3.2
* nso: 39.7
* nus: 16.6
* ny: 38.9
* oc: 51.9
* om: 58.5
* or: 77.4
* pa: 75.0
* pag: 47.6
* pap: 45.9
* pcm: 77.7
* pl: 69.7
* ps: 57.5
* pt: 63.2
* **Eleventh Row:**
* qu: 29.8
* rej: 75.8
* rn: 59.1
* ro: 72.9
* rom: 40.4
* ru: 78.7
* rw: 41.4
* sa: 40.8
* sat: 2.2
* sc: 46.2
* scn: 44.1
* sco: 29.8
* sd: 62.9
* sg: 25.6
* shn: 27.8
* **Twelfth Row:**
* si: 51.7
* sk: 57.6
* sl: 64.1
* sm: 25.1
* sn: 56.4
* so: 44.4
* sq: 68.4
* sr: 80.8
* ss: 39.4
* st: 41.0
* su: 71.6
* sv: 70.9
* sw: 59.9
* szl: 47.5
* ta: 75.9
* **Thirteenth Row:**
* taq: 6.3
* te: 78.6
* tg: 55.3
* th: 79.1
* ti: 49.2
* tk: 32.3
* tl: 64.6
* tn: 44.5
* tpi: 46.3
* tr: 79.5
* ts: 38.7
* tt: 41.6
* tum: 30.0
* tw: 32.2
* tzm: 3.8
* **Fourteenth Row:**
* ug: 27.1
* uk: 74.6
* umb: 22.0
* ur: 73.1
* uz: 63.7
* vec: 51.9
* vi: 81.1
* wa: 5.8
* war: 66.1
* wo: 41.8
* xh: 47.6
* yi: 21.6
* yo: 55.8
* yue: 56.3
* zh: 77.0
* **Fifteenth Row:**
* zu: 30.7
### Key Observations
* The heatmap shows a wide range of similarity scores between languages.
* Some languages exhibit high similarity (green cells), while others show low similarity (red/brown cells).
* The legend provides a clear visual reference for interpreting the similarity scores based on color.
* The lowest similarity scores are "sat" (2.2), "nqo" (3.2), "tzm" (3.8), "wa" (5.8), "taq" (6.3), "dz" (8.2), "kab" (9.2), "nus" (16.6), "gd" (21.9), "umb" (22.0), "kbp" (22.2), "ga" (22.5), "ee" (23.6), "bo" (23.6), "mni" (26.2), "dik" (26.7), "ug" (27.1), "shn" (27.8), "fj" (28.2), "ki" (28.7), "lua" (29.7), "sco" (29.8), "qu" (29.8).
* The highest similarity score is "mui" (86.8).
### Interpretation
The heatmap visualizes the relationships between different languages based on a similarity metric. The color-coding allows for quick identification of language pairs that are closely related (likely sharing common ancestry, vocabulary, or grammatical structures) versus those that are more distinct. This type of visualization is useful in fields like linguistics, language learning, and machine translation, where understanding language relationships is crucial. The "μ + 3σ" and "μ – 3σ" likely refer to statistical measures (mean + 3 standard deviations, and mean - 3 standard deviations), suggesting that the color scale is normalized based on the distribution of similarity scores. The outliers (very high or very low similarity scores) may warrant further investigation to understand the specific factors contributing to those relationships.
DECODING INTELLIGENCE...