\n
## Heatmap: Correlation Matrix
### Overview
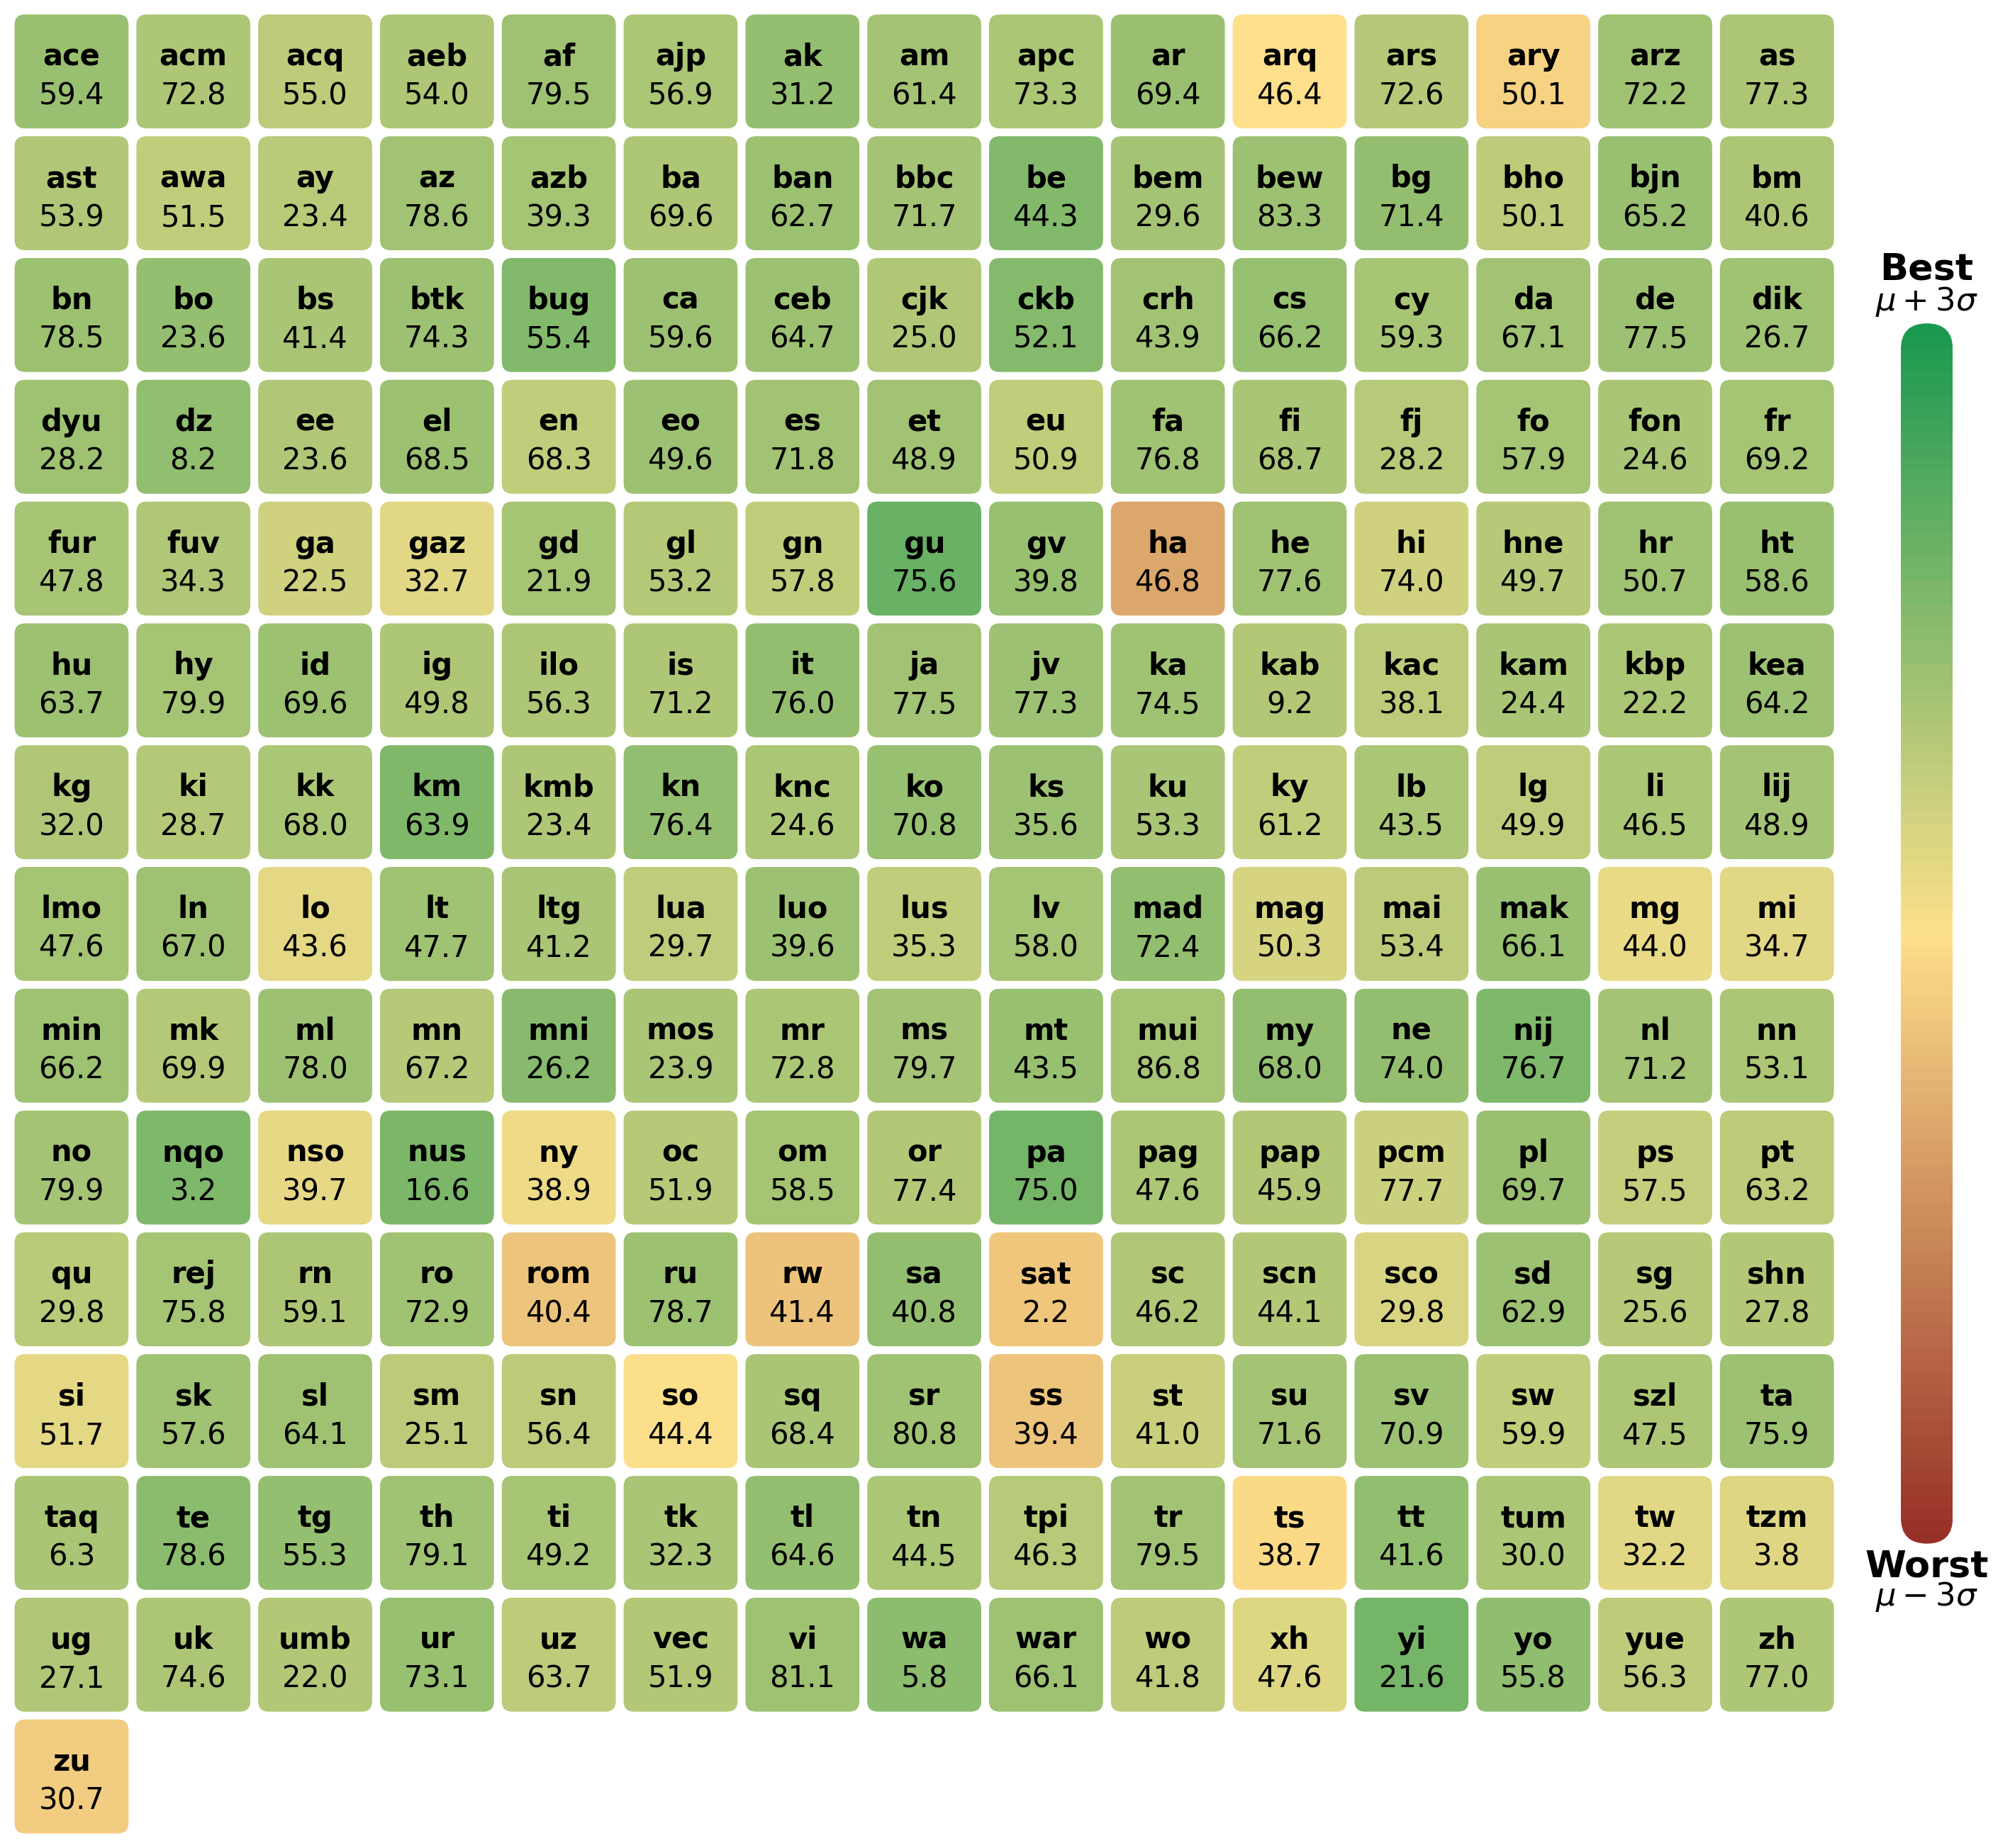
The image presents a heatmap displaying a correlation matrix. The matrix is labeled with two-letter codes along both the x and y axes, representing different variables or entities. The color intensity of each cell indicates the strength and direction of the correlation between the corresponding variables. The color scale ranges from blue (negative correlation) to red (positive correlation), with white representing no correlation. A legend is present at the bottom-right corner, mapping colors to correlation values. There is a label "Best μ+3σ" in the top-right corner.
### Components/Axes
* **X-axis:** Labeled with two-letter codes: ace, acm, acq, aeb, af, ajp, ak, am, apc, ar, arq, ars, ary, arz, as, ast, awa, ay, az, azb, ba, ban, bbc, be, bem, bew, bg, bho, bjn, bm.
* **Y-axis:** Labeled with two-letter codes: dyu, dz, ee, el, en, eo, es, et, eu, fa, fi, fj, fo, fon, fr, fur, fuv, ga, gaz, gd, gl, gn, gu, gv, ha, he, hi, hne, hr, ht.
* **Color Scale/Legend:** Located at the bottom-right. Ranges from blue (-1) to red (1), with white (0). Values indicated are -1, -0.5, 0, 0.5, 1.
* **Label:** "Best μ+3σ" located in the top-right corner.
### Detailed Analysis
The heatmap displays correlation coefficients between the variables represented by the two-letter codes. Due to the size of the matrix, a complete listing of all values is impractical. However, key observations can be made based on color intensity:
* **Strong Positive Correlations (Red):** Several cells exhibit strong positive correlations (close to 1). For example:
* `kk` and `km` show a very strong positive correlation (approximately 0.95-1.0).
* `it` and `ja` show a strong positive correlation (approximately 0.85-0.95).
* `tr` and `tu` show a strong positive correlation (approximately 0.85-0.95).
* **Strong Negative Correlations (Blue):** Fewer cells show strong negative correlations (close to -1).
* `dyu` and `dz` show a moderate negative correlation (approximately -0.5 to -0.6).
* **Near-Zero Correlations (White):** Many cells are white, indicating little to no correlation. For example:
* `ace` and `dyu` show a near-zero correlation.
* `ace` and `dz` show a near-zero correlation.
* **Moderate Correlations:** Many cells display moderate correlations (between -0.5 and 0.5) in varying shades of blue and red.
* **Specific Values (Approximate):**
* `ace` and `acm`: ~0.55
* `ace` and `acq`: ~0.55
* `ace` and `aeb`: ~0.54
* `dyu` and `ee`: ~0.68
* `dyu` and `el`: ~0.68
* `fur` and `fuv`: ~0.48
* `kg` and `ki`: ~0.32
* `kg` and `kk`: ~0.68
* `lmo` and `lmn`: ~0.47
* `lmo` and `lmp`: ~0.35
* `tr` and `ts`: ~0.66
* `tr` and `tt`: ~0.77
* `tr` and `tu`: ~0.95
* `va` and `vb`: ~0.34
* `va` and `vc`: ~0.25
### Key Observations
* The matrix appears to be symmetrical, as expected for a correlation matrix.
* There is a cluster of strong positive correlations among variables `kk`, `km`, `kn`, `ko`, `ks`, `ku`, `ky`, `lb`, `lg`, `li`, `lij`.
* The "Best μ+3σ" label suggests that the data used to generate this correlation matrix may have been pre-processed or filtered based on a statistical criterion involving the mean (μ) and standard deviation (σ). This implies that only the most significant correlations are being displayed.
* The distribution of correlation values is not uniform, with a higher concentration of values near zero.
### Interpretation
This heatmap represents the relationships between a set of variables. The strong positive correlations suggest that certain variables tend to increase or decrease together. The strong negative correlations indicate that variables move in opposite directions. The "Best μ+3σ" label implies that the matrix focuses on the most statistically significant correlations, potentially filtering out noise or less relevant relationships.
The clustering of strong positive correlations suggests that the variables within those clusters are likely related to a common underlying factor or process. The heatmap could be used to identify redundant variables (those with very high correlations) or to understand the complex interplay between different variables in a system. The absence of strong negative correlations could indicate a generally harmonious relationship between the variables, or it could simply be a result of the data selection or pre-processing.
Without knowing the specific meaning of the two-letter codes, it is difficult to provide a more specific interpretation. However, the heatmap provides a valuable visual summary of the correlation structure within the dataset. The data suggests a complex interplay of relationships, with some variables strongly linked and others largely independent. Further investigation would be needed to understand the underlying causes of these correlations and their implications.