## Line Graphs: Coalition Exploitability Across Parameters
### Overview
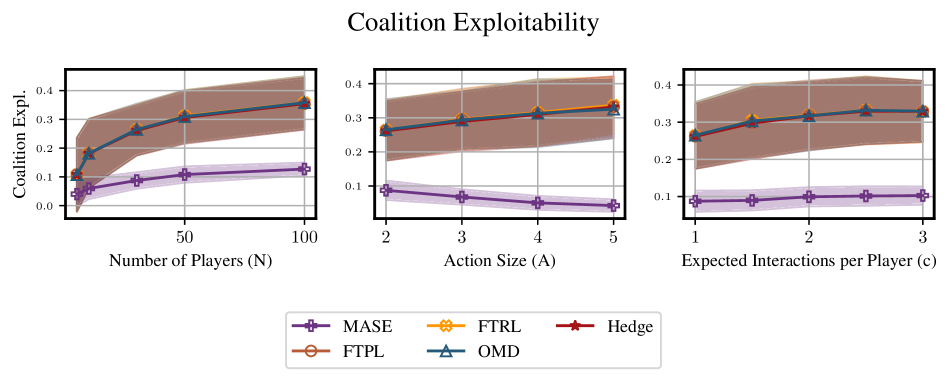
Three line graphs visualize coalition exploitability metrics across three parameters: number of players (N), action size (A), and expected interactions per player (c). Each graph compares five methods (MASE, FTRL, Hedge, FTPL, OMD) using colored lines with shaded confidence intervals. The y-axis consistently measures "Coalition Expl." (exploitability) from 0 to 0.4.
### Components/Axes
1. **X-Axes**:
- Left: "Number of Players (N)" (0–100)
- Center: "Action Size (A)" (2–5)
- Right: "Expected Interactions per Player (c)" (1–3)
2. **Y-Axis**: "Coalition Expl." (0–0.4) across all graphs
3. **Legend**: Located at bottom center, mapping:
- Purple: MASE
- Orange: FTRL
- Red: Hedge
- Brown: FTPL
- Blue: OMD
### Detailed Analysis
#### Left Graph (Number of Players)
- **MASE (Purple)**: Starts at ~0.05 (N=0), rises to ~0.12 (N=100) with gradual slope.
- **FTRL (Orange)**: Begins at ~0.18 (N=0), peaks at ~0.32 (N=100) with steep upward trend.
- **Hedge (Red)**: Similar to FTRL, starts at ~0.17 (N=0), reaches ~0.31 (N=100).
- **FTPL (Brown)**: Starts at ~0.15 (N=0), rises to ~0.30 (N=100) with moderate slope.
- **OMD (Blue)**: Begins at ~0.12 (N=0), increases to ~0.28 (N=100) with steep curve.
- **Confidence Intervals**: Widest for FTRL/Hedge (brown/orange shading), narrowest for MASE (purple).
#### Center Graph (Action Size)
- **MASE (Purple)**: Flat line at ~0.08 across A=2–5.
- **FTRL (Orange)**: Starts at ~0.28 (A=2), rises to ~0.34 (A=5) with gentle slope.
- **Hedge (Red)**: Similar to FTRL, starts at ~0.27 (A=2), reaches ~0.33 (A=5).
- **FTPL (Brown)**: Starts at ~0.25 (A=2), increases to ~0.31 (A=5).
- **OMD (Blue)**: Flat at ~0.22 across all A values.
- **Confidence Intervals**: Overlap significantly between FTRL/Hedge (orange/red shading).
#### Right Graph (Expected Interactions)
- **MASE (Purple)**: Flat at ~0.07 across c=1–3.
- **FTRL (Orange)**: Starts at ~0.26 (c=1), rises to ~0.32 (c=3) with moderate slope.
- **Hedge (Red)**: Similar to FTRL, starts at ~0.25 (c=1), reaches ~0.31 (c=3).
- **FTPL (Brown)**: Starts at ~0.24 (c=1), increases to ~0.29 (c=3).
- **OMD (Blue)**: Flat at ~0.20 across all c values.
- **Confidence Intervals**: Narrowest for MASE (purple), widest for FTRL (orange).
### Key Observations
1. **Method Performance**:
- FTRL and Hedge consistently show highest exploitability across all parameters.
- MASE demonstrates lowest exploitability with minimal variation.
- OMD maintains moderate exploitability with flat trends.
2. **Parameter Sensitivity**:
- Exploitability increases with player count (N) and action size (A) for most methods.
- Expected interactions (c) show weaker correlation with exploitability.
3. **Confidence Intervals**:
- FTRL and Hedge exhibit highest uncertainty (widest shading).
- MASE shows tightest confidence intervals, suggesting stable performance.
### Interpretation
The data reveals that FTRL and Hedge methods are most vulnerable to coalition exploitation, with exploitability increasing as system complexity grows (more players, larger action spaces). MASE emerges as the most robust method, maintaining low exploitability across all scenarios. The flat trends in OMD and MASE suggest these methods are less sensitive to parameter changes. The widening confidence intervals for FTRL/Hedge indicate greater variability in their performance under different conditions, potentially due to algorithmic instability or sensitivity to input parameters. This analysis implies that MASE may be preferable for applications requiring predictable coalition behavior, while FTRL/Hedge require careful parameter tuning or additional safeguards in complex environments.