\n
## Diagram: Information Flow from Nature to Label
### Overview
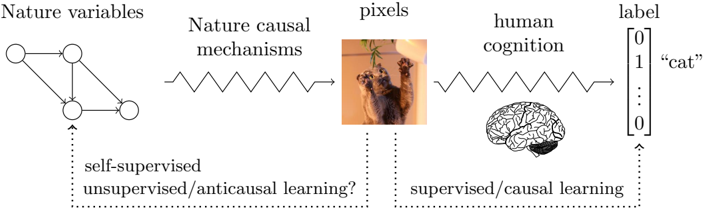
The image is a diagram illustrating the flow of information from "Nature variables" to a "label", mediated by "Nature causal mechanisms", "pixels", and "human cognition". It depicts a process that can be interpreted through the lens of different learning paradigms (self-supervised, supervised, causal). The diagram uses a combination of abstract representations (nodes and edges, wavy lines) and a concrete image (a cat).
### Components/Axes
The diagram consists of five main components arranged horizontally from left to right:
1. **Nature variables:** Represented by a network of six interconnected circles.
2. **Nature causal mechanisms:** Represented by a wavy line with an arrow pointing to the right.
3. **Pixels:** A photograph of a cat with its paws raised.
4. **Human cognition:** Represented by a stylized image of a human brain.
5. **Label:** A vertical array of numbers and text.
Additionally, there are two dotted boxes connecting the "Nature variables" to "pixels" and "Human cognition" to "Label", with text indicating learning paradigms.
### Detailed Analysis or Content Details
The diagram shows a directional flow from left to right.
* **Nature variables:** Six circles are connected by lines, forming a network. The connections suggest relationships or dependencies between the variables.
* **Nature causal mechanisms:** The wavy line indicates a transformation or process acting on the "Nature variables", resulting in "pixels".
* **Pixels:** The image within this component is a photograph of a cat, appearing to be looking up with its paws raised.
* **Human cognition:** The brain image represents the processing of the "pixels" by a human observer.
* **Label:** The label is a vertical array with the following content:
* `[0]`
* `[1]`
* `"cat"`
* `[0]`
* `[0]`
* The array suggests a classification or categorization process, where the cat image is associated with the label "cat" (represented by the value 1). The other values are 0, indicating a negative or absent classification.
The dotted boxes contain the following text:
* **Left Box:** "self-supervised unsupervised/anticausal learning?"
* **Right Box:** "supervised/causal learning"
### Key Observations
* The diagram highlights the transition from abstract variables in nature to a concrete representation (pixels) and then to human interpretation (cognition) and finally to a symbolic label.
* The use of "pixels" as an intermediate step suggests a digital or image-based processing stage.
* The association of the cat image with the label "cat" demonstrates a supervised learning scenario.
* The question mark in the left box indicates uncertainty about the learning paradigm involved in the initial transformation from nature variables to pixels.
### Interpretation
The diagram illustrates a simplified model of how information is processed from the natural world to a human-understandable label. It emphasizes the role of both causal mechanisms and cognitive interpretation in this process. The diagram also raises questions about the nature of learning, specifically whether the initial stages of information processing can be considered self-supervised, unsupervised, or anticausal. The contrast between the left and right dotted boxes suggests a shift from potentially less structured learning (self-supervised/unsupervised) to a more directed, supervised learning approach. The diagram is a conceptual illustration rather than a precise quantitative representation of data. It is a visual argument about the stages of information processing and the different learning paradigms that might be involved. The inclusion of the cat image serves as a relatable example to ground the abstract concepts.